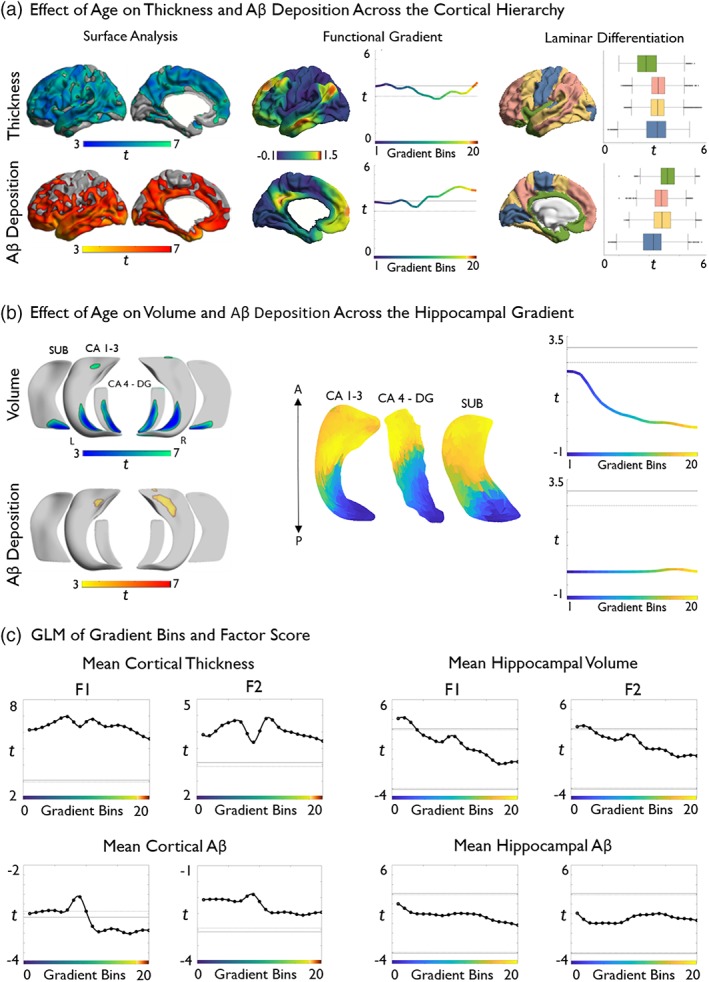
Figure 3.

Topographic profiling of age effects and cognitive correlations in neocortical and hippocampal regions. (a) Age effects on vertex‐wise cortical thickness and Aβ deposition (left), mapped to a reference space based on neocortical functional connectivity gradients (center, adapted from Margulies et al., 2016), resulting in a continuous profile of thickness values that can be correlated with age (right). In the profile, primary sensory regions are situated toward the left and transmodal regions toward the right. Profiles show consistently high aging effects on cortical thickness across the entire neocortical gradient. Aβ shows a similar pattern, but higher values toward the transmodal end. (b) Vertex‐wise age effects on hippocampal subregional volume and Aβ deposition (left), mapped to a “long‐axis” reference space based on hippocampal functional connectivity gradients (center, adapted from Vos de Wael et al., 2018), showing more elevated deposition in anterior subregions. Right hemisphere gradients were virtually identical. (c) Gradient‐based stratification of correlations between F1 and F2 on neocortical (left panels) and hippocampal measures (right panels). Solid lines represent significant t‐values using Bonferroni correction, whereas dashed lines represent significant t‐values using FDR‐correction for multiple comparisons (one‐tailed p < .025). If the curve is above the positive lines, then brain marker values within that given bin significantly predict a higher cognitive score. Likewise, if the curve is below the negative lines then this is predictive of lower cognitive scores. If the curve falls between positive and negative lines, no statistical significance was achieved [Color figure can be viewed at http://wileyonlinelibrary.com]
