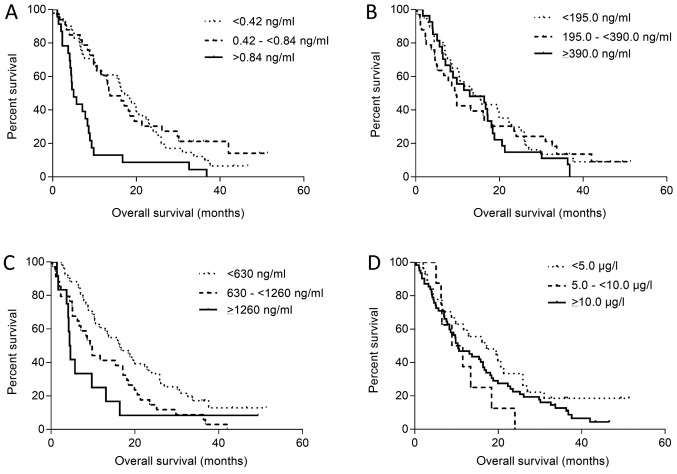
Figure 4.
Overall survival according to HSP60, CHI3L1, IGFBP-2 and CEA levels. Kaplan-Meier curves. Difference between curves was calculated by log-rank test. Kaplan-Meier curves of patient (A) HSPp60, (B) CHI3L1, (C) IGFBP-2 and (D) CEA levels. HSP60, heat shock protein 60; CHI3L1, chitinase-3-like protein 1; IGFBP-2, insulin-like growth factor binding protein 2; CEA, carcinoembryonic antigen.

