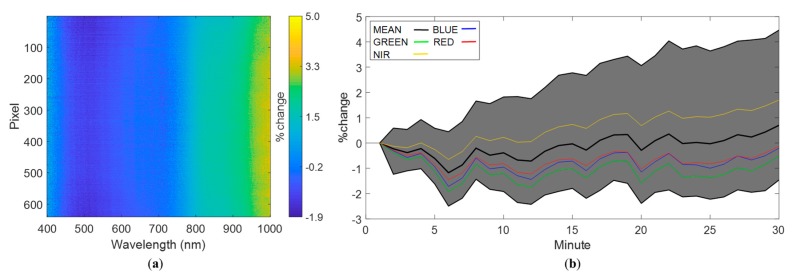
Figure 5.
Temporal analysis for the white reference experiment at an exposure of 12.5 ms, showing (a) percentage of variation between the first and the last radiance measurement at 30 min, and (b) time series analysis of the percentage of variation in radiance from the first measurement. The gray region represents the area enclosed between the maximum and minimum values of relative difference. The global mean is depicted in black, the mean for the RGB regions of the spectrum are depicted in red, green, and blue, respectively, and the NIR region is shown in yellow.

