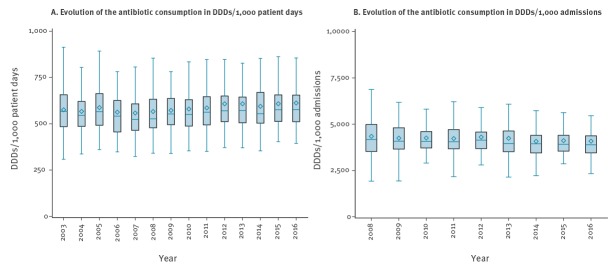
Figure 1.
Evolution of the consumption of antibacterials for systemic use (ATC code J01) in acute care hospitals, Belgium, 2003–2016
ATC: Anatomical Therapeutic Chemical classification; DDD: defined daily doses; IQR: interquartile range.
Legend boxplot: the upper whisker indicates the maximum value (that is not an outlier, 1.5xIQR); the top of the box indicates the 75th percentile (P75); the middle line of the box indicates the median; the diamond indicates the mean; the bottom of the box indicates the 25th percentile (P25); and the bottom whisker indicates the minimum value (that is not an outlier, 1.5xIQR).
For results based on the number of admissions (B), we only have data starting from 2008.

