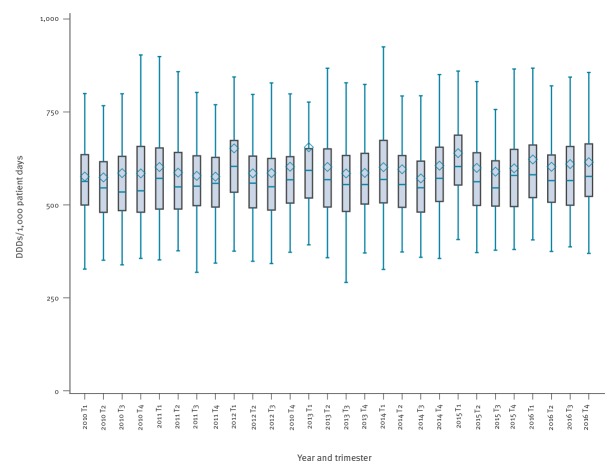
Figure 2.
Evolution of the consumption of antibacterials for systemic use (ATC code J01) per trimester in acute care hospitals, Belgium, 2010–2016
ATC: Anatomical Therapeutic Chemical classification; DDD: defined daily doses; IQR: interquartile range.
T1: trimester 1, January-March; T2: trimester 2, April-June; T3: trimester 3, July-September; T4: trimester 4, October-December.
Legend boxplot: the upper whisker indicates the maximum value (that is not an outlier, 1.5xIQR); the top of the box indicates the 75th percentile (P75); the middle line of the box indicates the median; the diamond indicates the mean; the bottom of the box indicates the 25th percentile (P25); and the bottom whisker indicates the minimum value (that is not an outlier, 1.5xIQR).

