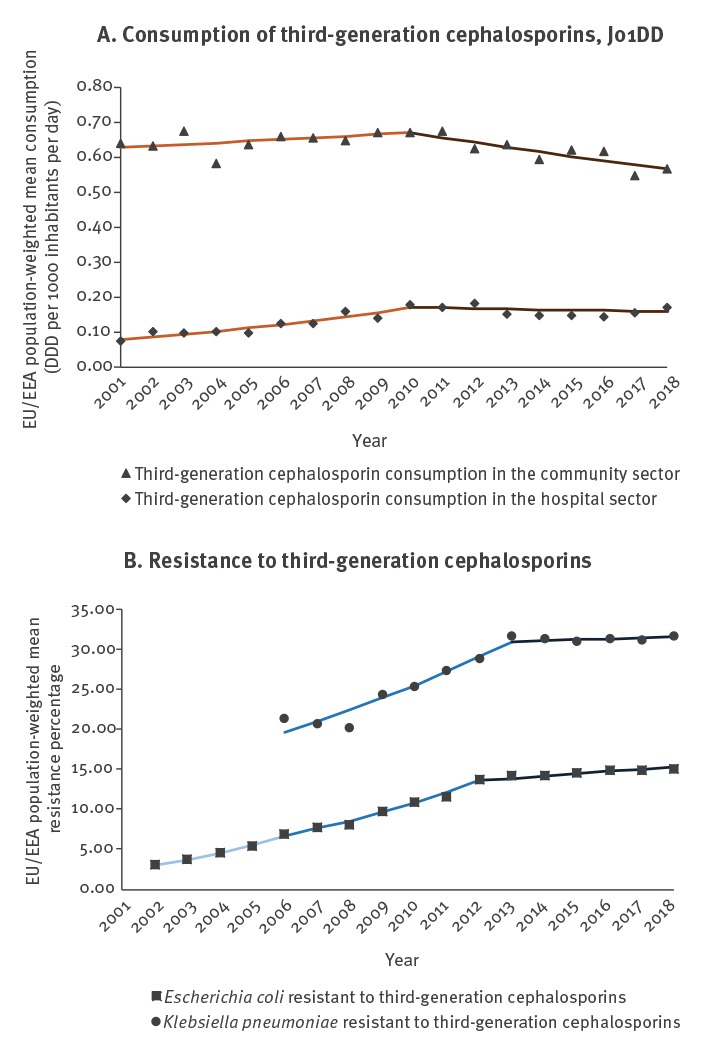
Figure 1.
Consumption of third-generation cephalosporins by sector and third-generation cephalosporin resistance by microorganism, including detected trend segments, EU/EEA population-weighted means, 2001–2018
DDD: defined daily doses; EU/EEA: European Union and European Economic Area.
Antimicrobial consumption trend segments are shown in red. AMR trend segments are shown in blue.