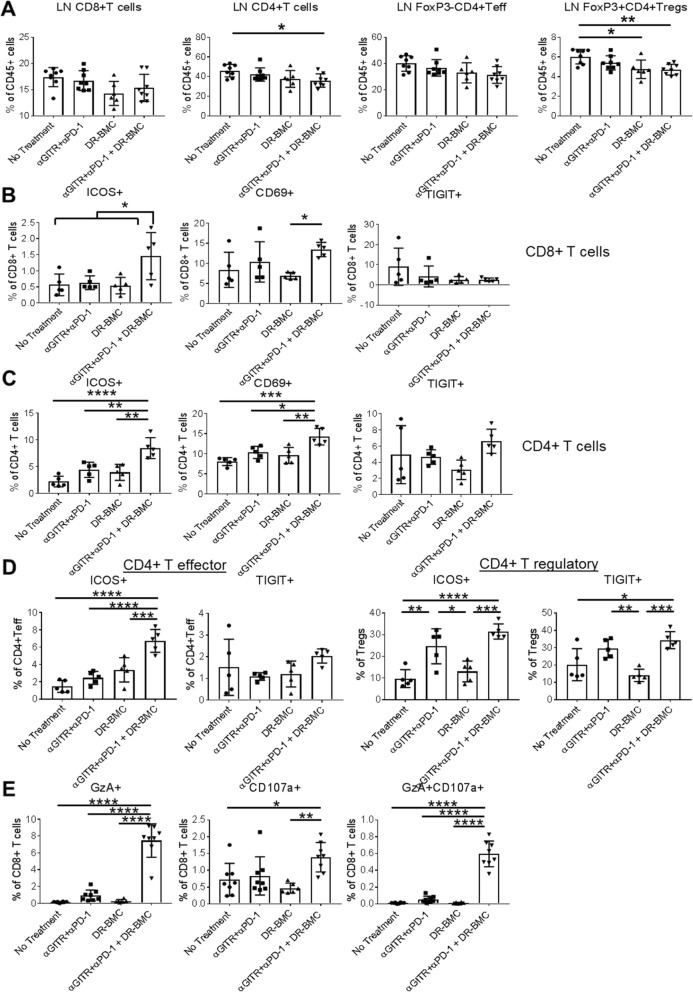
Fig. 5.
Increased T cell activation in lymph nodes of tritherapy-treated mice. a, LNs were harvested and analyzed by flow cytometry 7 days after p.t. DR-BMC administration. Pooled data from 2 independent experiments are shown here. b, Same as a but activation markers on CD8+ T cells and c, CD4+ T cells were analyzed. Shown is representative data of 4 independent experiments for ICOS expression, 2 independent experiments for CD69 expression and one experiment for TIGIT expression. d, Same as a-c, but activation markers on effector FoxP3-CD4+ T cells versus FoxP3 + CD4+ Tregs are shown. Representative data from 2 independent experiments are shown. e, Same as a-d, but cytolytic potential of CD8+ T cells from the lymph nodes are shown. Pooled data from 2 independent experiments are shown. b-e One-Way ANOVA

