Fig. 3.

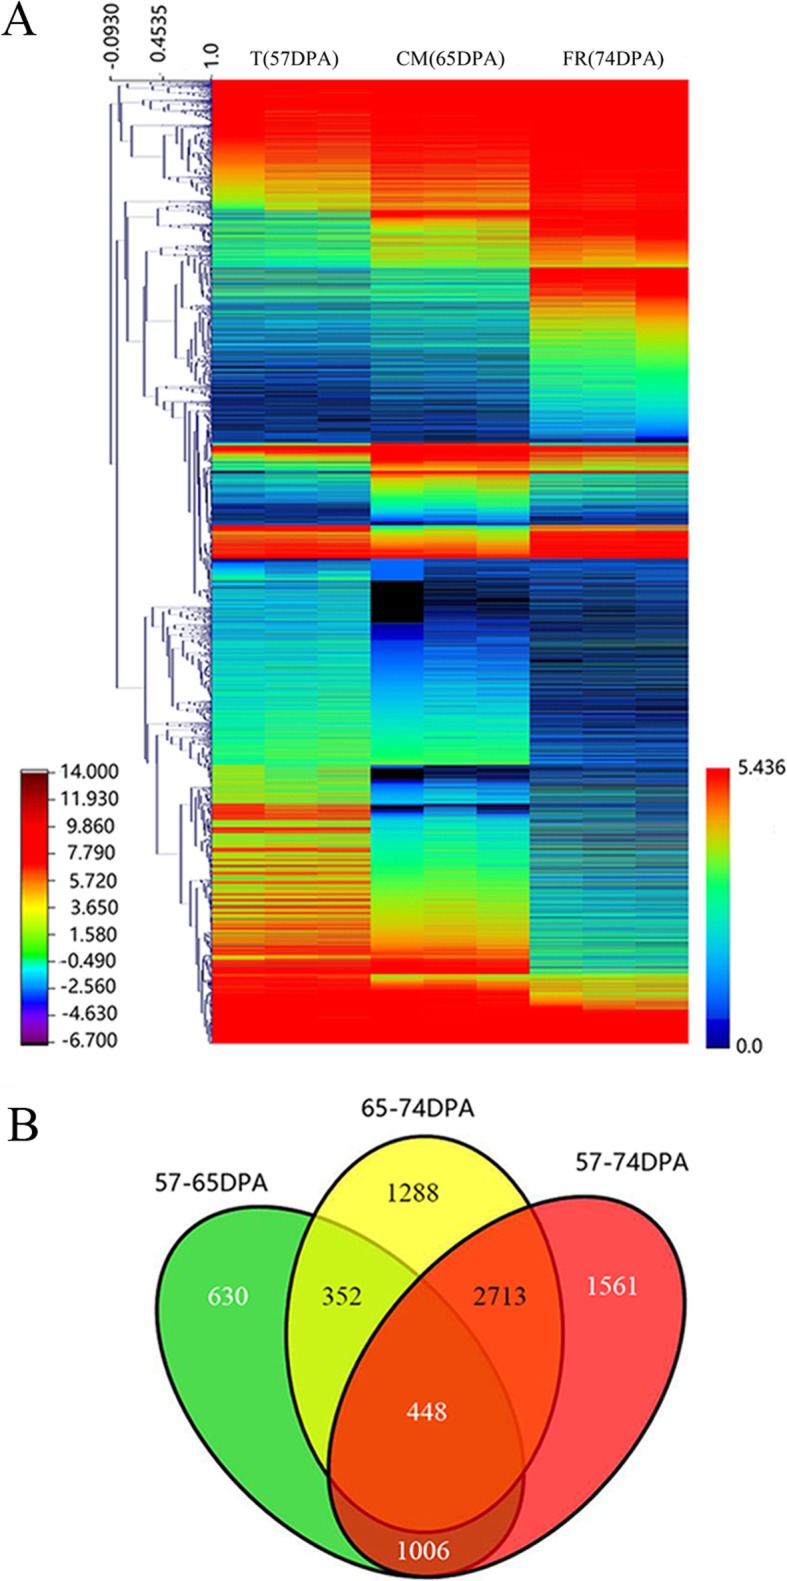
Expression profiles of differentially expressed genes (DEGs) during apricot fruit ripening. a DEG expression dynamics during fruit ripening. b Venn diagram indicates the number of DEGs in each of the three ripening stages

Expression profiles of differentially expressed genes (DEGs) during apricot fruit ripening. a DEG expression dynamics during fruit ripening. b Venn diagram indicates the number of DEGs in each of the three ripening stages