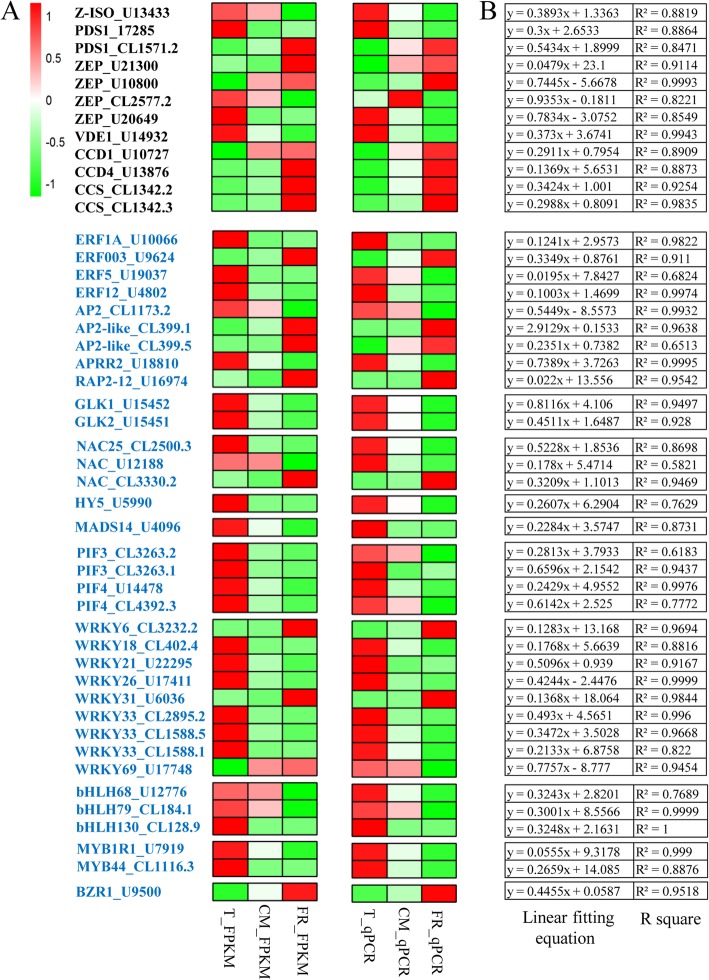
Fig. 7.
The expression of genes and regulators related to carotenoid metabolism in the visualized networks for the ‘blue’ and ‘turquoise’ modules. a Heatmap of the expression of structural genes related to carotenoid biosynthesis during fruit ripening. Columns and rows in the heat map represent the developmental stage and gene name, respectively. The black and blue genes represent structural genes and transcription factors, respectively. Red, green and white indicate high expression, low expression and the absence (or undetectable levels) of detectable transcripts at the corresponding stage, respectively. b The linear fitting equation and R squared values between the FPKM and qRT-PCR values

