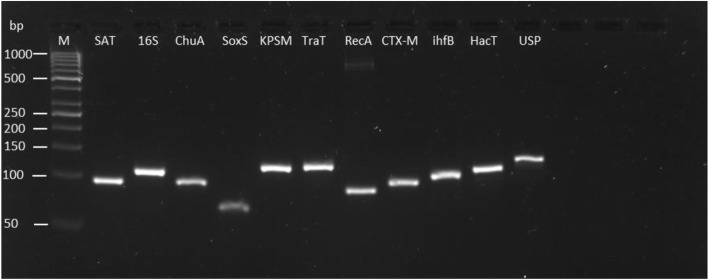
Fig. 1.
The specificity of each primer pair investigated by qRT-PCR for this study. End amplified products of qPCR were visualised using agarose gel electrophoresis. All genes were detected at the expected bp size and single band was observed for each primer pair indicating primer specificity. M, Molecular Weight marker, GeneRuler 50 bp DNA Ladder (Thermofisher, UK). Products and ladder ran on 4% Agarose gel.

