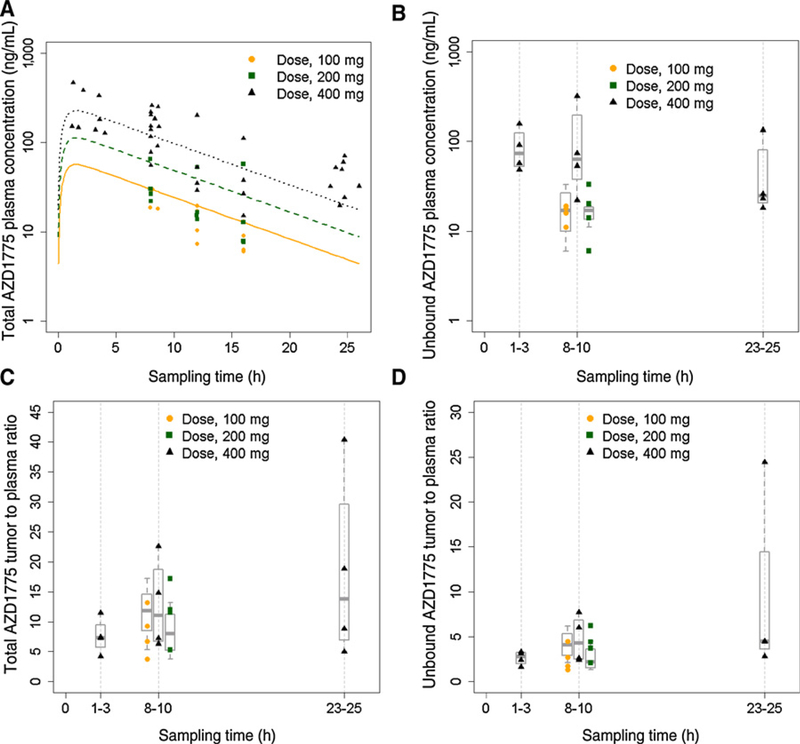
Figure 2.
AZD1775 plasma and tumor pharmacokinetics in patients with glioblastoma receiving a single oral dose. A, AZD1775 total plasma concentration-time profiles. Symbols represent observed concentrations; solid, dash, and dot lines represent pharmacokinetic profiles fitted by the final population pharmacokinetic model. B, Unbound AZD1775 tumor concentrations. C, AZD1775 total tumor-to-plasma concentration ratios. D, AZD1775 unbound tumor-to-plasma concentration ratios. Symbols represent observed data; boxplot represents 25th, 50th (median), and 75th percentiles of the observed data.

