Fig. 1.
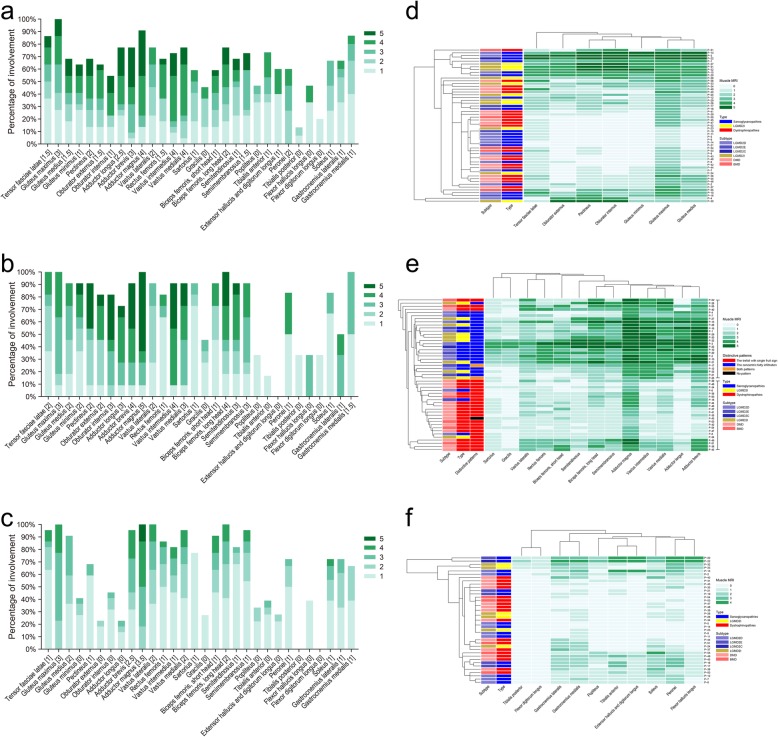
Summary of pelvis, thigh, and lower leg muscle involvement in DGC-related muscular dystrophies. a–c Frequency of fatty infiltration of the individual muscles was represented as a percentage of the all. Green bars represented the percentage of muscles affected for each score. The numbers within the square brackets indicated the median score for each muscle. d Hierarchical clustering of patients according to the individual pelvis muscles showing that patients did not cluster according to the genotypes. e In hierarchical clustering of patients according to the individual thigh muscles, 23 of the 26 clustered patients (upper group) showed the concentric fatty infiltration pattern, and 22 of the 23 clustered patients (lower group) showed the trefoil with single fruit sign. f Hierarchical clustering of patients according to the lower leg individual muscles showing that patients did not cluster according to the genotypes. DGC, dystrophin-glycoprotein complex; LGMD, limb-girdle muscular dystrophy; DMD, Duchenne muscular dystrophy; BMD, Becker muscular dystrophy

