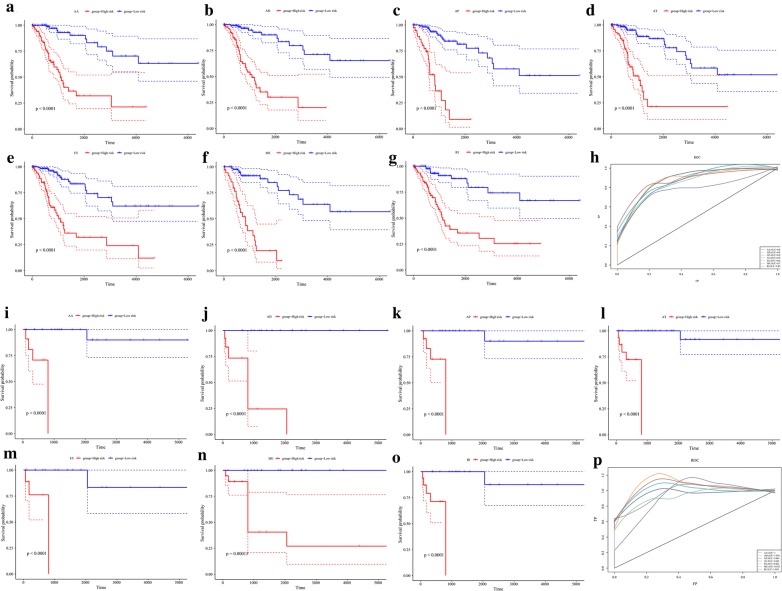
Fig. 4.
Cervical cancer AS event prognostic factor analysis. a–g Kaplan–Meier curves of prognostic predictors associated with overall survival constructed with each type of AS event for cervical cancer patients. The red line indicates a high-risk group, while the blue line indicates a low-risk group. h ROC curves with AUCs for overall survival constructed with each type of AS event in cervical cancer. i–o Kaplan–Meier curves of prognostic predictors associated with recurrence constructed with each type of AS event for cervical cancer patients. The red line indicates a high-risk group, while the blue line indicates a low-risk group. p ROC curves with AUCs for recurrence constructed with each type of AS event in cervical cancer

