Figure 4.
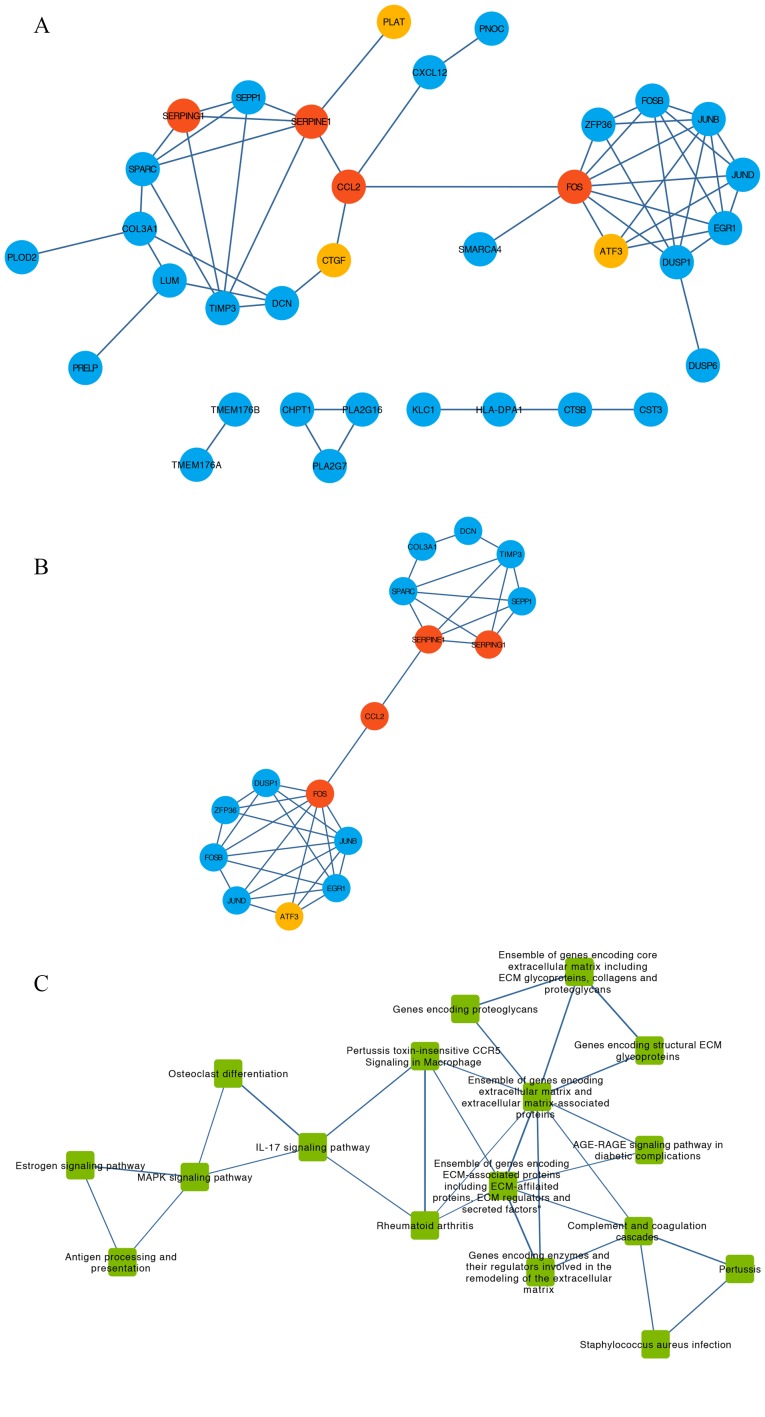
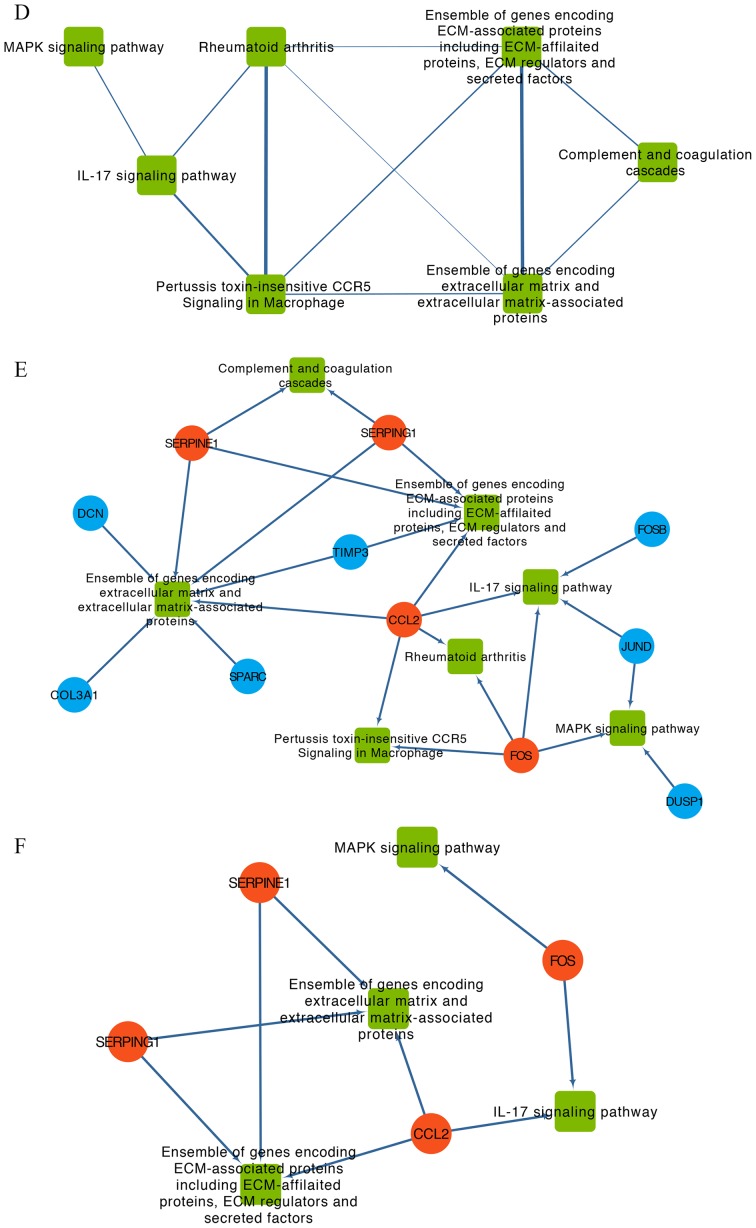
PPI network, pathway crosstalk and gene-pathway analyses of the DEGs from the GSE9116 dataset. (A) PPI network of candidate genes. Red, core genes. Orange, top three up-regulated genes. Blue, other DEGs. (B) Subnetwork of PPI network for hub genes of which nodal degree > average. Red, core genes. Orange, top three up-regulated genes. Blue, other DEGs. (C) Pathway crosstalk analysis of DEGs. Edge thickness represents the average value of Jaccard and Overlapping Coefficient. (D) Subnetwork of pathway crosstalk extracted by the criterion nodal degree > average. (E) Comprehensive gene-pathway network established by mapping the hub genes to the subnetwork. The arrow direction between gene and pathway was determined from Kyoto Gene and Genome Encyclopedia database and BioCarta. Red circle, core genes. Blue circle, other DEGs. Green square, pathways. (F) Subnetwork of gene-pathway collected according to the criterion nodal degree > average; Red circle, core genes. Green square, pathways. ATF3, activating transcription factor 3; CCL2, C-C motif chemokine ligand 2; CTGF, cellular communication network factor 2; DEGs, differentially expressed genes; FOS, Fos proto-oncogene, AP-1 transcription factor subunit; PLAT, plasminogen activator, tissue type; PPI, protein-protein interaction; SERPINE1, serpin family E member 1; SERPING1, serpin family G member 1.


