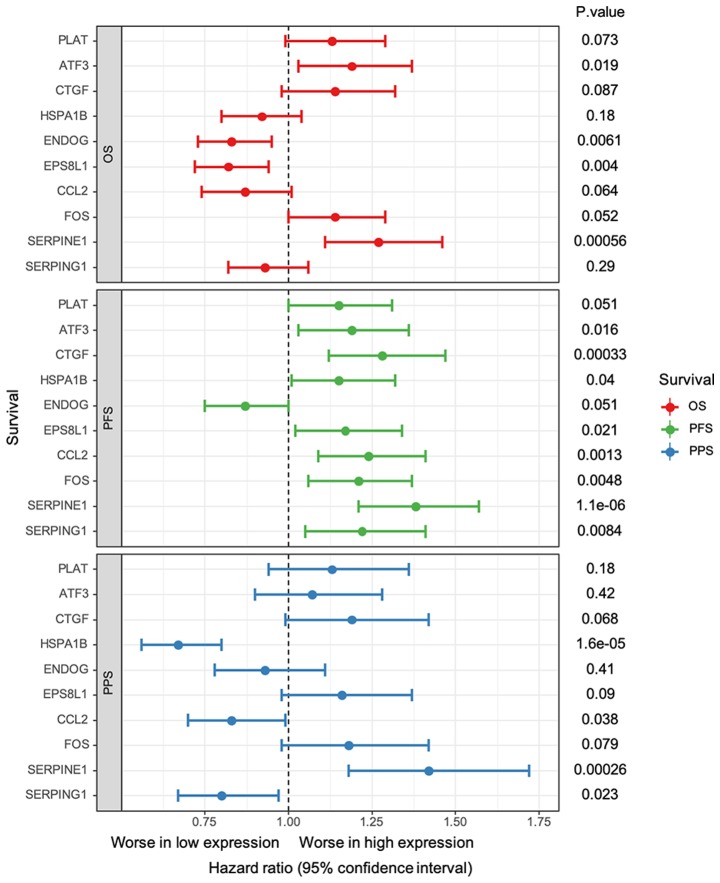
Figure 6.
Survival analysis of the core genes; CCL2, FOS, SERPINE1 and SERPING1, and the top three up/downregulated genes; PLAT, ATF3, CTGF, HSPA1B, ENDOG and EPS8L1. Vertical dotted line represents no effect for the pooled relative risk estimation. If the confidence intervals for individual gene overlap with this line, it means that the survival between low and high expression is not significant. ATF3, activating transcription factor 3; CCL2, C-C motif chemokine ligand 2; CTGF, cellular communication network factor 2; DEGs, differentially expressed genes; ENDOG, endonuclease G; EPS8L1, EPS8 like 1; FOS, Fos proto-oncogene, AP-1 transcription factor subunit; HSPA1B, heat shock protein family A (Hsp70) member 1B; OS, overall survival; PFS, progression-free survival; PLAT, plasminogen activator, tissue type; PPI, protein-protein interaction; PPS, post-progression survival; SERPINE1, serpin family E member 1; SERPING1, serpin family G member 1.

