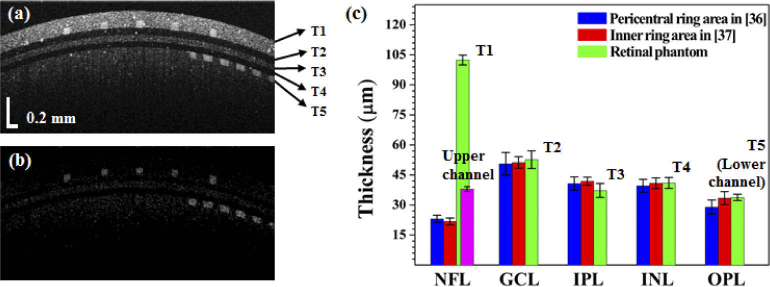
Fig. 6.
Cross-sectional OCT and OCTA images of phantom with a 5% intralipid concentration and thickness comparisons. (a) Cross-sectional OCT image, (b) Cross-sectional OCTA image. (c) Plot of the thickness values for the various layers and comparison of outcomes between the phantom and human [37,38]: T1 = 102.42 ± 2.40 µm, T2 = 52.67 ± 4.40 µm, T3 = 37.28 ± 3.48 µm, T4 = 41.04 ± 2.69 µm, and T5 = 33.82 ± 1.57 µm. The purple bar is the thickness of the upper microfluidic channel, which was measured to be equal to 38.03 ± 1.20 µm.

