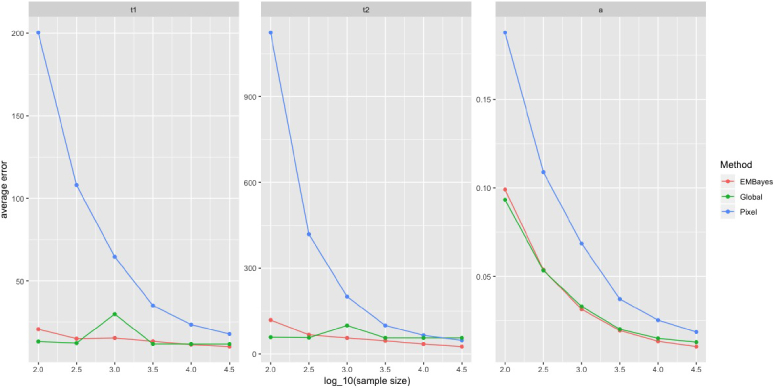
Fig. 6.
Pixel-wise recovery performance comparisons between pixel-wise analysis, global analysis, and NEB-FLIM: the plots are of mean square error across the image against the number of photons per pixel. All results of lifetimes in the figures are shown in . Left is plot of ; middle is plot of and right is plot of .

