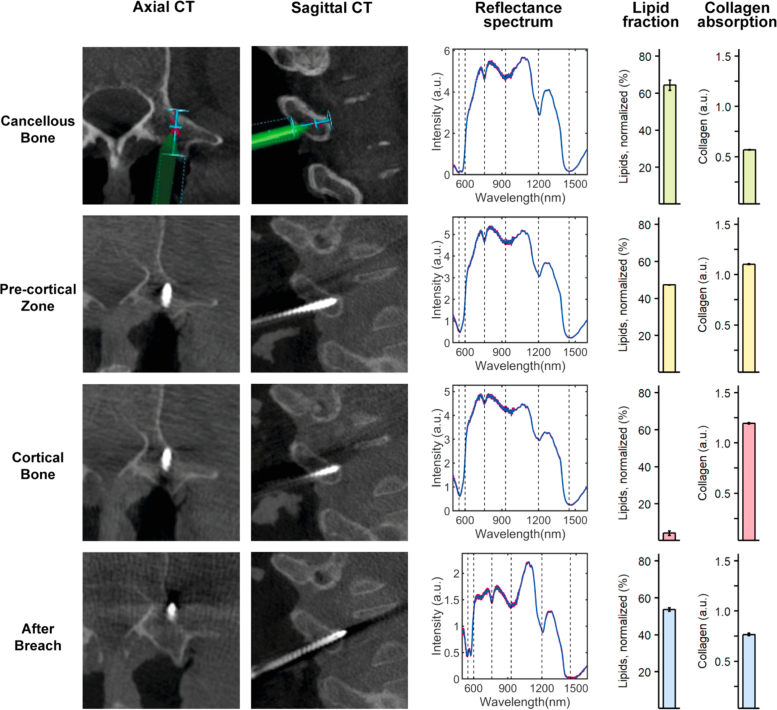
Fig. 3.
DR spectroscopy readings and associated imaging of a lateral pedicle screw breach. The first and second column shows axial and sagittal computed tomographies (CT) of each position, respectively. For cancellous bone, imaging from the navigation software is shown, since pedicle screw depth was not enough to allow for a CT. The screw is represented in green and the planned trajectory in blue. The third column shows acquired spectra at each position in red and the fitted spectrum in blue. The fourth and fifth column shows the measured lipid and collagen fractions, respectively.

