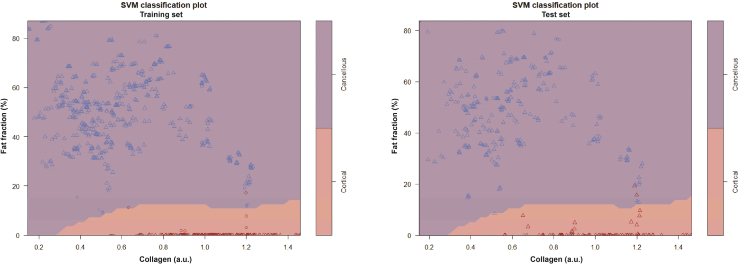
Fig. 9.
SVM classification plots depicting the fat fraction and collagen content of all cancellous (blue) and cortical (red) readings. To the left, a plot of the training set (n = 746). To the right, a similar plot on the test set (n = 384). Purple areas highlight everything classified as cancellous bone by the SVM, while red areas are classified as cortical. Data points used as support vectors for the SVM are depicted as circles, the rest are depicted as triangles. For this SVM, only the fat fraction and collagen parameters were used.

