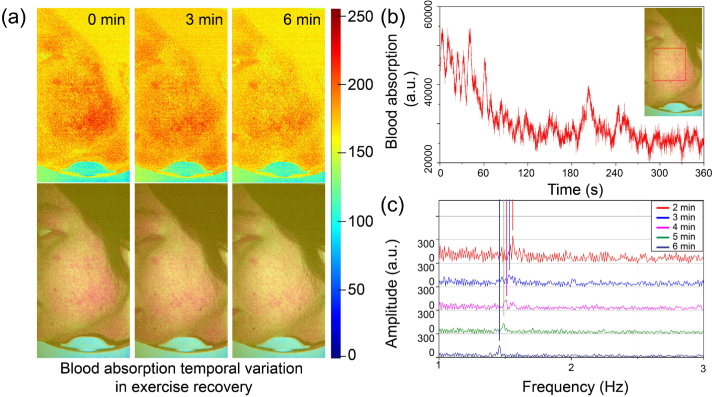
Fig. 6.
Exercise recovery monitoring with the snapshot-hyperspectral-camera-based multispectral imaging system. (a) The hemoglobin absorption information map (top row, color-coded according to color bar shown in the right) and overlaid images (bottom row) of the left facial skin at different time points of the recovery. (b) Real-time response curve of blood absorption information content during exercise recovery. The red dotted box area on the left is the targeted region for analysis. (c) The heartrate measurements of 5 recovery segments at 2, 3, 4, 5 and 6 minutes, respectively.

