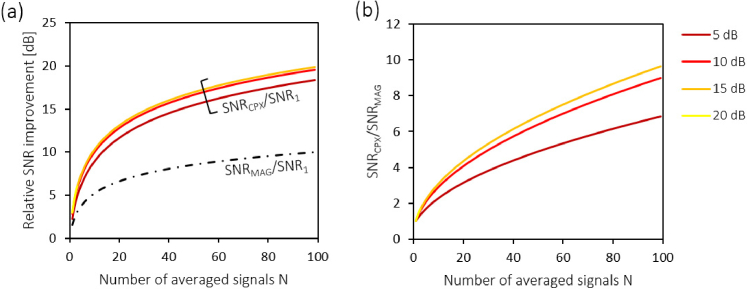
Fig. 3.
Relative SNR improvement by signal averaging for strong input signals (without noise bias correction). (a) The ratios SNRCPX/SNR1 and SNRMAG/SNR1 are shown for from 1 to 100. SNRMAG/SNR1 is plotted as a dash-dotted line, whereas the SNR1-dependent ratio SNRCPX/SNR1 is plotted in rainbow colors for several SNR1 values between 5 dB and 50 dB. Note that SNRCPX/SNR1 converges to an N-fold improvement. (b) The ratio is plotted for the spectrum of SNR1 values used in (a). Note that in particular for strong input signals with high SNR1, complex averaging outperforms magnitude averaging and converges to a -fold better SNR performance. As the SNR profiles converge for large SNRs, the curves in (a) and (b) start to overlap for values greater than 15 dB.

