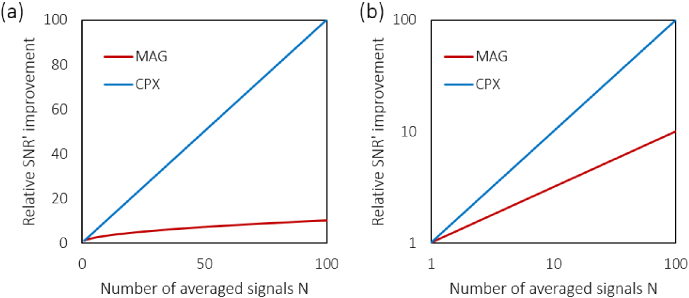
Fig. 6.
Theoretical improvement of the signal-to-noise ratio SNR′ after noise bias correction plotted on (a) linear scales and (b) log scales. A - and N-fold improvement of the SNR′ of a single signal can be observed for magnitude and complex averaging, respectively. Note that, unlike for the noise-afflicted SNR calculations in Figs. 3 through 5, neither of the averaging approaches depend on the input signal strength.

