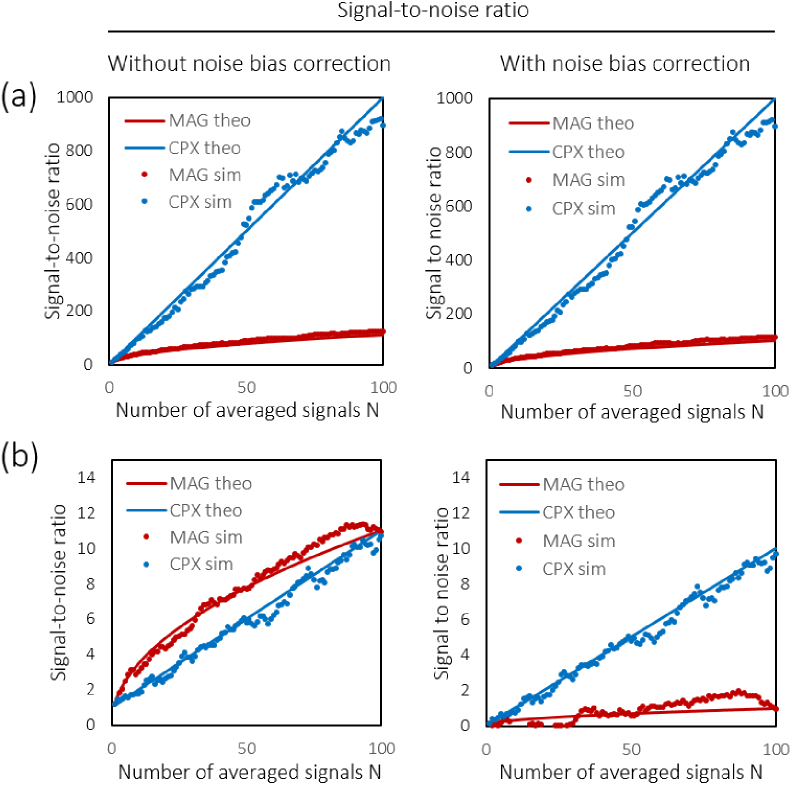
Fig. 7.
Simulation of the effect of averaging signals with relative strength in (a) and in (b). Shown are the averaged signal-to-noise ratios calculated from simulated phasors () alongside the corresponding theoretical plots (−). The SNRs without and with noise bias correction are plotted in the left and right panels, respectively. Without noise bias correction, the SNRCPX shows a better performance for the strong signal in (a), whereas SNRMAG dominates for to 100 both for theoretical calculation and simulation. With noise bias correction (rightmost column), complex averaging similarly provides an N-fold improvement of the respective SNR′ = I/2σ2 whereas an -fold improvement can be observed for magnitude averaging.

