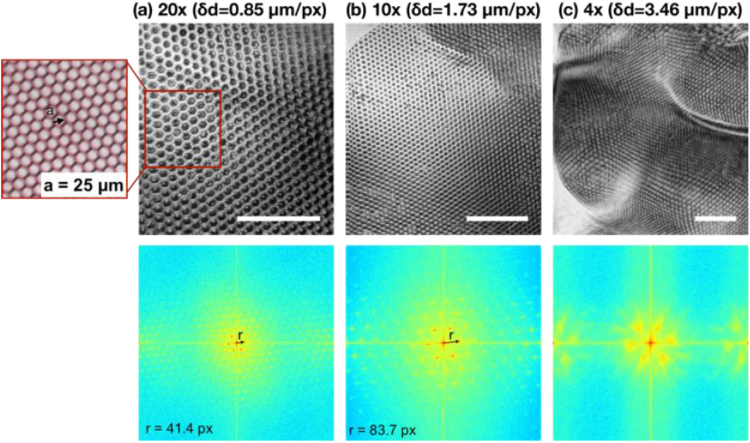
Fig. 2.
En face OCT images as well as its corresponding spatial frequency spectra of the hexagonal grid taken with (a) 20X, (b) 10X, and (c) 4X objectives, respectively. The spatial sampling interval was 0.85 µm, 1.73 µm, and 3.46 µm for 20X, 10X, and 4X objectives, respectively. The characteristic frequency, marked by “r”, was measured to be 42.4/1024 px−1 and 83.7/1024 px−1 for 20X and 10X maps, respectively. The 4X objective failed to resolve the periodic grid patterns and therefore the characteristic frequency was not given here. Inset: white light camera image of the hexagonal grid. Scale bar: 200 µm.

