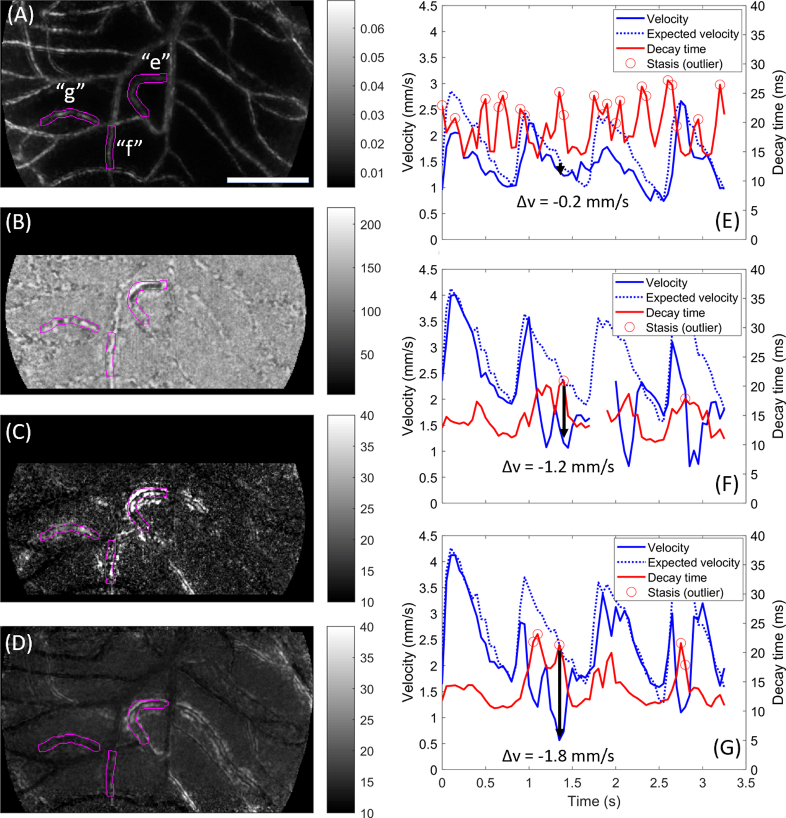
Fig. 4.
Examples of the three categories of stasis captured during a single epoch. Data acquired over 3.3 sec at 300 fps with 750 nm light, 1.5° from the foveal centre in a healthy subject. A) Motion contrast (division image) for the sequence, with 3 vessels of interest labelled (“e”, “f”, “g”) and highlighted in magenta. B) Single processed frame from an example epoch (at t≈1.4s). In segment e, a cellular aggregate creates a dark appearance. In segment f, an uninterrupted column of plasma creates a bright appearance, which extends significantly along the segment above. In segment g the capillary shows typical single file alternating flow; these observations can be verified in Visualization 6 (6.1MB, avi) . C) Decay time image for the same epoch corresponding to B, which shows elevated decay time within and, notably, around all 3 vessels of interest. D) Average decay time metric for this sequence. Segment e shows consistently elevated decay time; segments f and g do not. E) Evolution of flow velocity (blue) and decay time (red) for segment e. Expected velocity based on the field average is indicated (dashed blue). Black arrow corresponds to the example epoch; minimal change from expected velocity is noted here despite a spike in the decay time. Outliers in decay time are indicated (circles). F) Plot for segment f, as per panel E. The extended plasma length noted in the example epoch was associated with a significant drop in velocity (black arrow). G) Plot for segment g, as per panel E. Velocity is slowed significantly from the expected value despite normal capillary contents; inspection of Visualization 6 (6.1MB, avi) reveals this is associated with “traffic” due to passage of the cell aggregate in segment e (segments e and g feed into the same collecting segment). Scale bar is 100 µm.

