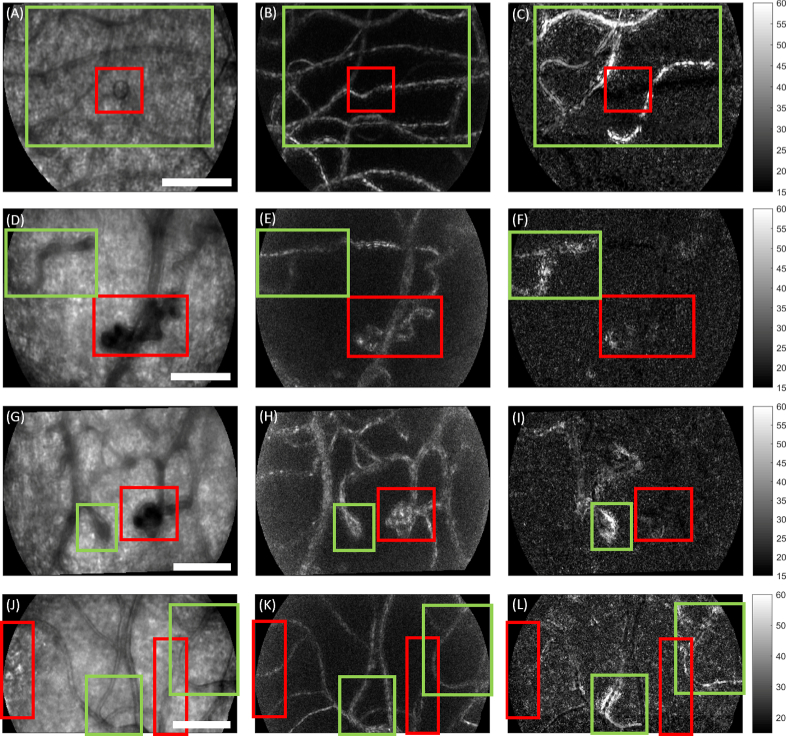
Fig. 6.
Epochs of relative capillary stasis associated with sub-clinical microvascular pathology in Type I diabetes. Data collected at 200 fps with 593 nm light from 3 subjects without clinically observed retinopathy based on colour fundus photography. Each row depicts a different imaged field. Columns from left to right show mean intensity, division motion contrast, and decay time during a 100 ms epoch. Red boxes indicate the most obvious pathology in each field based on the intensity image. Green boxes show areas of relative stasis, i.e. elevated decay time. A-C) A small cyst is surrounded by several static appearing vessels, which contain long, slowly moving cell aggregates as seen in Visualization 7 (5.2MB, avi) . D-F) A highly tortuous “knot” structure shows little elevation in decay time, but a nearby, less severe malformation does show elevated decay time. In the accompanying sequence (Visualization 8 (6.6MB, avi) ), the latter structure appears to dissipate high flow from the right into much slower flow to the left, over a very short distance. G-I) A microaneurysm is neighboured by a tight loop. Decay time appears elevated in the loop only. Accompanying sequence shown in Visualization 9 (6.5MB, avi) . J-L) Hyperreflective spots and microvascular abnormality are seen in the vicinity of two vessels showing elevated decay time. Inspection of the accompanying sequence (Visualization 10 (5.8MB, avi) ) shows passage of long cell aggregates accompanied by extreme apparent variations in the vessel width for the vessel indicated by the left-hand green box; the vessel in the right-hand green box shows long cell aggregates undergoing extremely slow flow. Scale bars = 100 µm.

