Fig. 3.
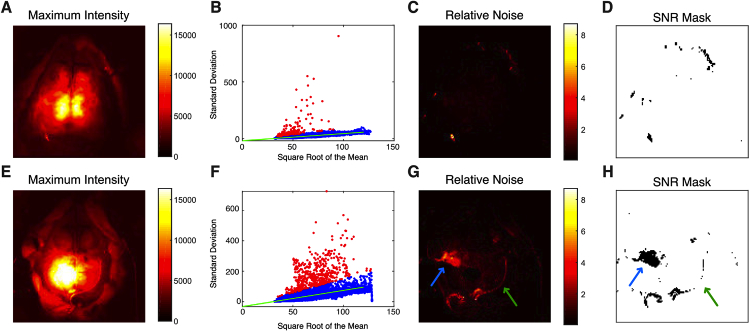
Example data demonstrating the signal-to-noise pixel quality metric. Data is shown prior to affine transformation. (A) Maximum intensity image (same as Fig. 2(A)) shown as an anatomic reference. (B) The standard deviation of each pixel over time is plotted against the square root of the intensity. Data is from mouse 2, session 5. The linear regression line of best fit is shown in green. Pixels meeting the SNR threshold are colored blue while pixels that failed and will be excluded from analysis are shown in red. (C) Image of the standard deviation for each pixel divided by the square root of the mean intensity for the same data. (D) SNR mask created from the data in C. In this session, only a few pixels were excluded based on this metric (shown in black). (E-H) The same analysis as A-D, now for mouse 3, session 3. Here, while the data is noisier, the same linear relationship holds. Pixels at the border of the dental cement (green arrows) show lower SNR and are excluded (black pixels in H). Additionally, there is a small region in the left sensorimotor cortex (blue arrows) that has low signal-to-noise, which upon examination of the data seems to be due to instability in the camera read-out. Individual low quality pixels can be excluded, and the entire run need not be discarded.

