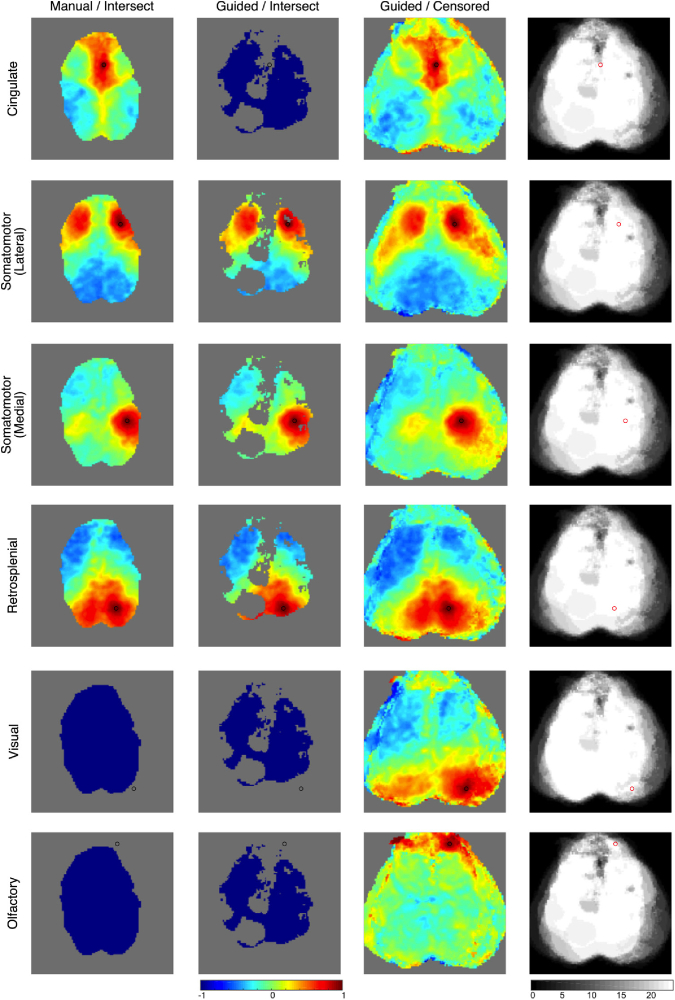
Fig. 11.
Demonstration of methods for combining data across mice. Data is shown after affine transformation. Each row is a different canonical resting-state network as shown by seed-based functional connectivity with the seed denoted by the circle (black or red). The first column uses manually segmented data merged using the intersect method. The second column is data segmented using the guided segmentation and then merged with the intersect method. The third column is data segmented using the guided segmentation and then merged using the censored method. The fourth column shows the number of sessions contributing data for each pixel’s correlation coefficient when calculated using the censored method. When seeds are selected that are outside of the field-of-view of the intersect method data, then the segmented brain is shown entirely in blue.

