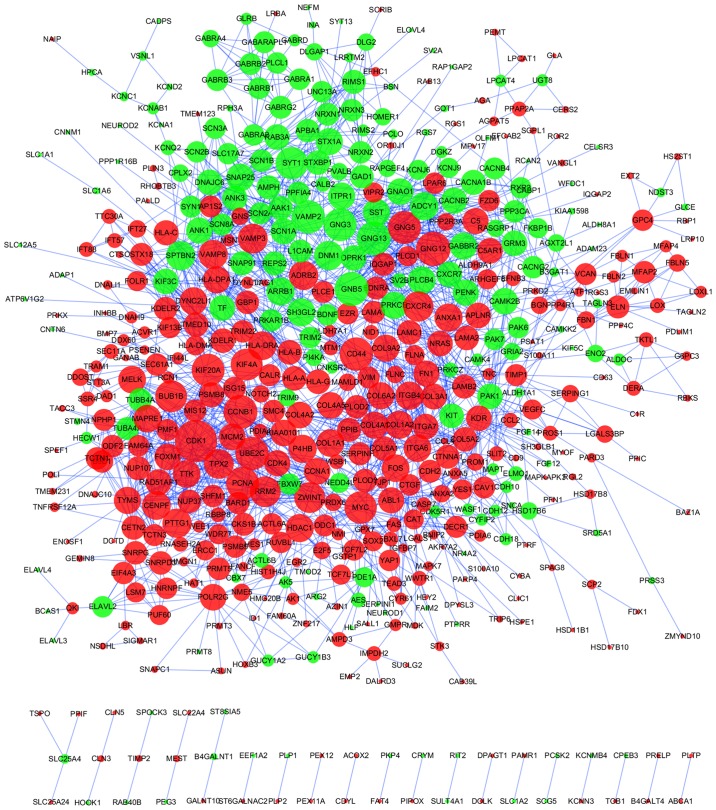
Figure 3.
Protein-protein interaction regulatory network of DEGs in ependymoma. Nodes represent DEGs. Red nodes indicate upregulated DEGs and green nodes indicated downregulated DEGs. Nodes with higher degree values are depicted with larger shapes. Edges/lines stand for the regulatory association between any 2 nodes. DEGs, differentially expressed genes.

