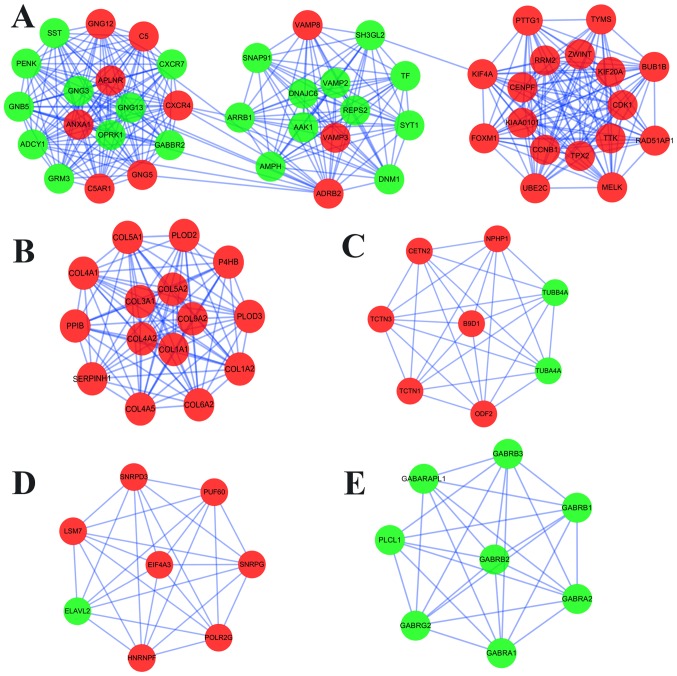
Figure 4.
Top 5 modules in the protein-protein interaction network for DEGs. (A) Module 1. (B) Module 2. (C) Module 3. (D) Module 4. (E) Module 5. Nodes represent DEGs. Edges/lines stand for the regulation association between any 2 nodes. Red and green nodes represent upregulated and downregulated genes, respectively. DEGs, differentially expressed genes.

