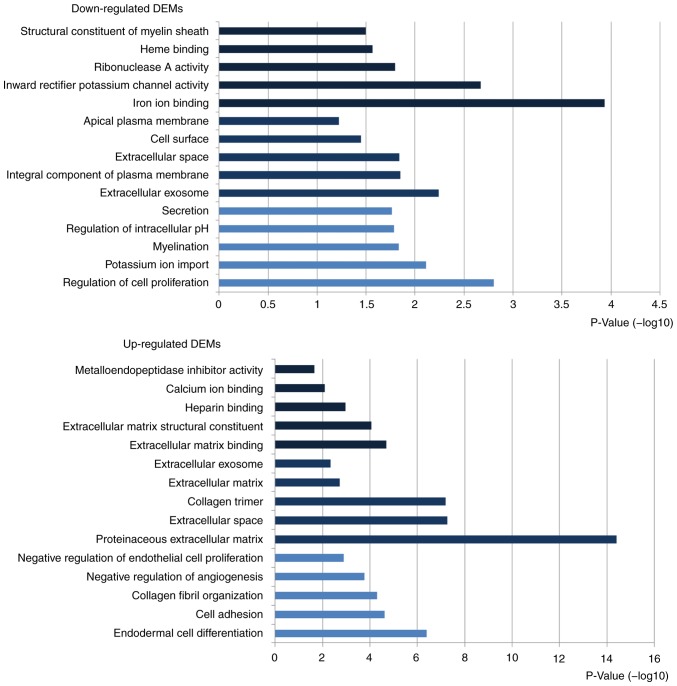
Figure 2.
Top 5 enriched Gene Ontology terms of upregulated and downregulated DEMs. [Black represents biological processes, dark blue indicates cellular component, and light blue denotes molecular function; -Log10 (P-value) represents the value of x-axes]. P<0.05. DEM, differentially expressed mRNA.

