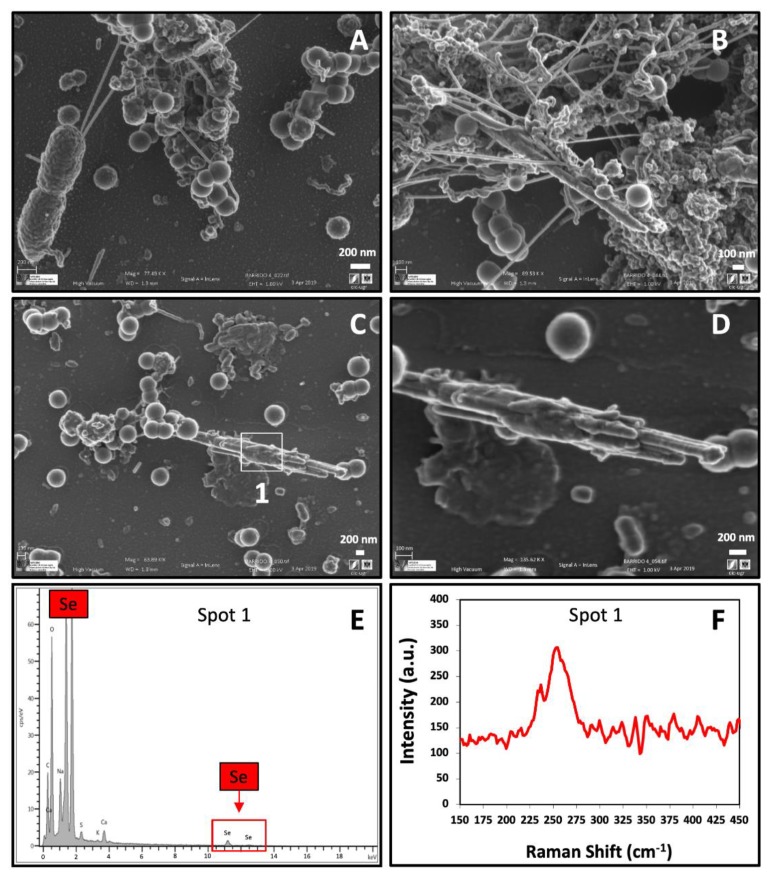
Figure 7.
VP-FESEM micrographs showing SeNPs associated with organic materials and filaments (A,B) and Se nanowires within the extracellular space (C,D) under anaerobic conditions at an initial pH of 10. EDX analysis of an individual nanowire indicates its Se composition (E). Raman scattering spectrum derived from the same nanowire (F). Scale bars: 200 nm (A,C,D) and 100 nm (B).

