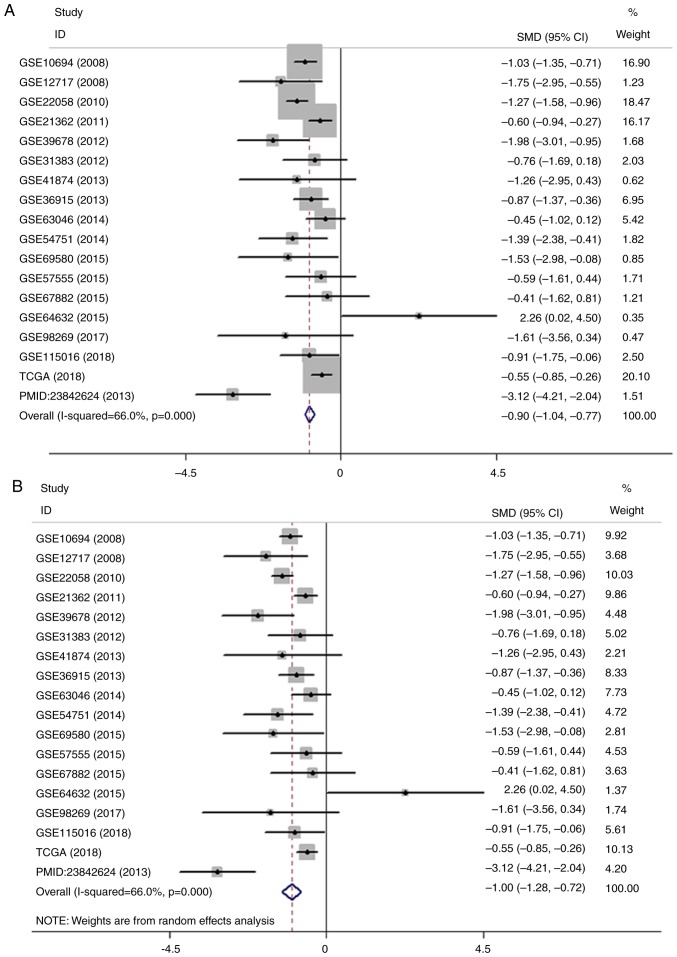
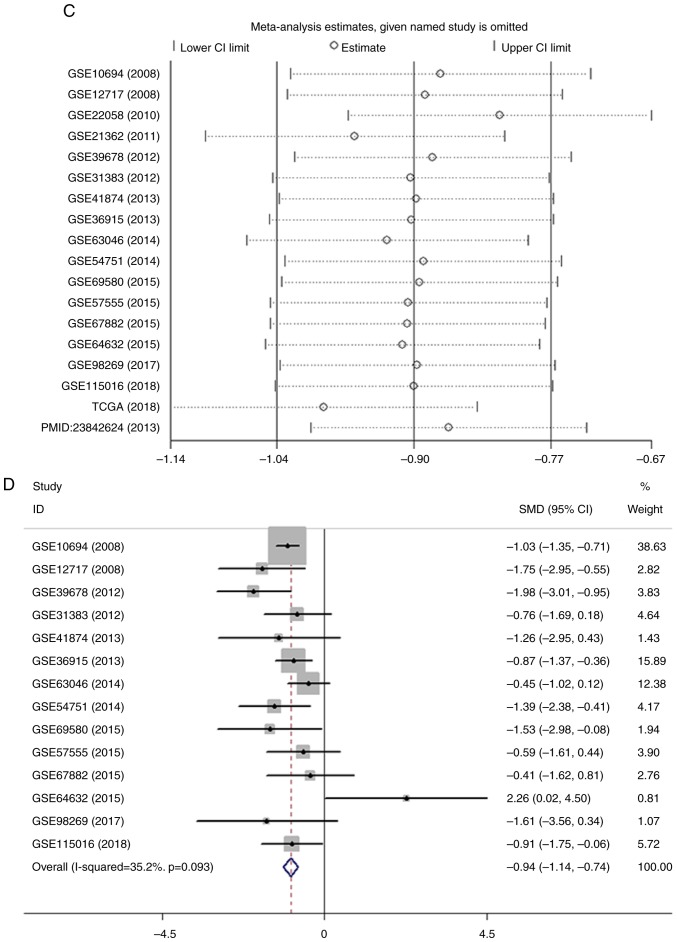
Figure 3.
Meta-analysis of the differential expression of miR-100-5p in HCC and non-cancerous tissues. (A) Forest plot of miR-100-5p expression datasets from Gene Expression Omnibus, TCGA and an article. The fixed effects model indicated that the pooled SMD was −0.90 (95% CI, −1.04 to −0.77; I2, 66.0%; P<0.001. (B) Forest plot of the pooled SMD of miR-100-5p was −1.00 (95% CI, −1.28 to −0.72; I2, 66.0%; P<0.001) using the random effects model. Meta-analysis of the differential expression of miR-100-5p in HCC and non-cancerous tissues. (C) Sensitivity analysis of the included studies. (D) Forest plot with the data leading to heterogeneity removed. The pooled SMD was −0.94 (95% CI, −1.14 to −0.74; I2, 35.2; P=0.093). miR, microRNA; HCC, hepatocellular carcinoma; CGA, The Cancer Genome Atlas; SMD, standard mean difference; CI, confidence interval.


