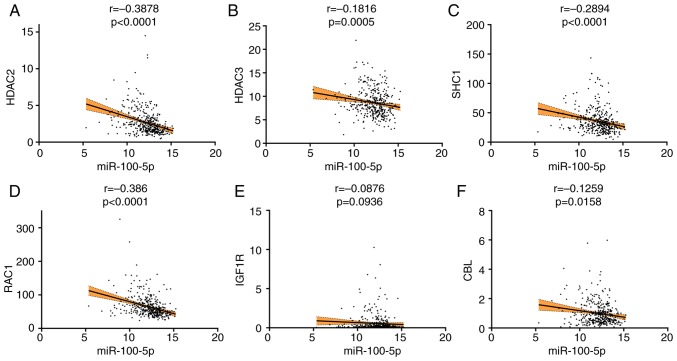
Figure 8.
Spearman correlation analysis between miR-100-5p and potential target genes. (A) HDAC2 (r= −0.387; P<0.0001); (B) HDAC3 (r= −0.1816; P=0.0005); (C) SHC1 (r= −0.2894; P<0.0001); (D) RAC1 (r= −0.386; P<0.0001); (E) IGF1R (r= −0.0876; P=0.0936); and (F) CBL (r= −0.1259; P=0.0158). miR, microRNA; HDAC, histone deacetylate; SHC1, SHC-transforming protein 1; RAC1, Ras-related protein Rac1; IGF1R, insulin like growth factor 1 receptor; CBL, E3 ubiquitin-protein ligase CBL.

