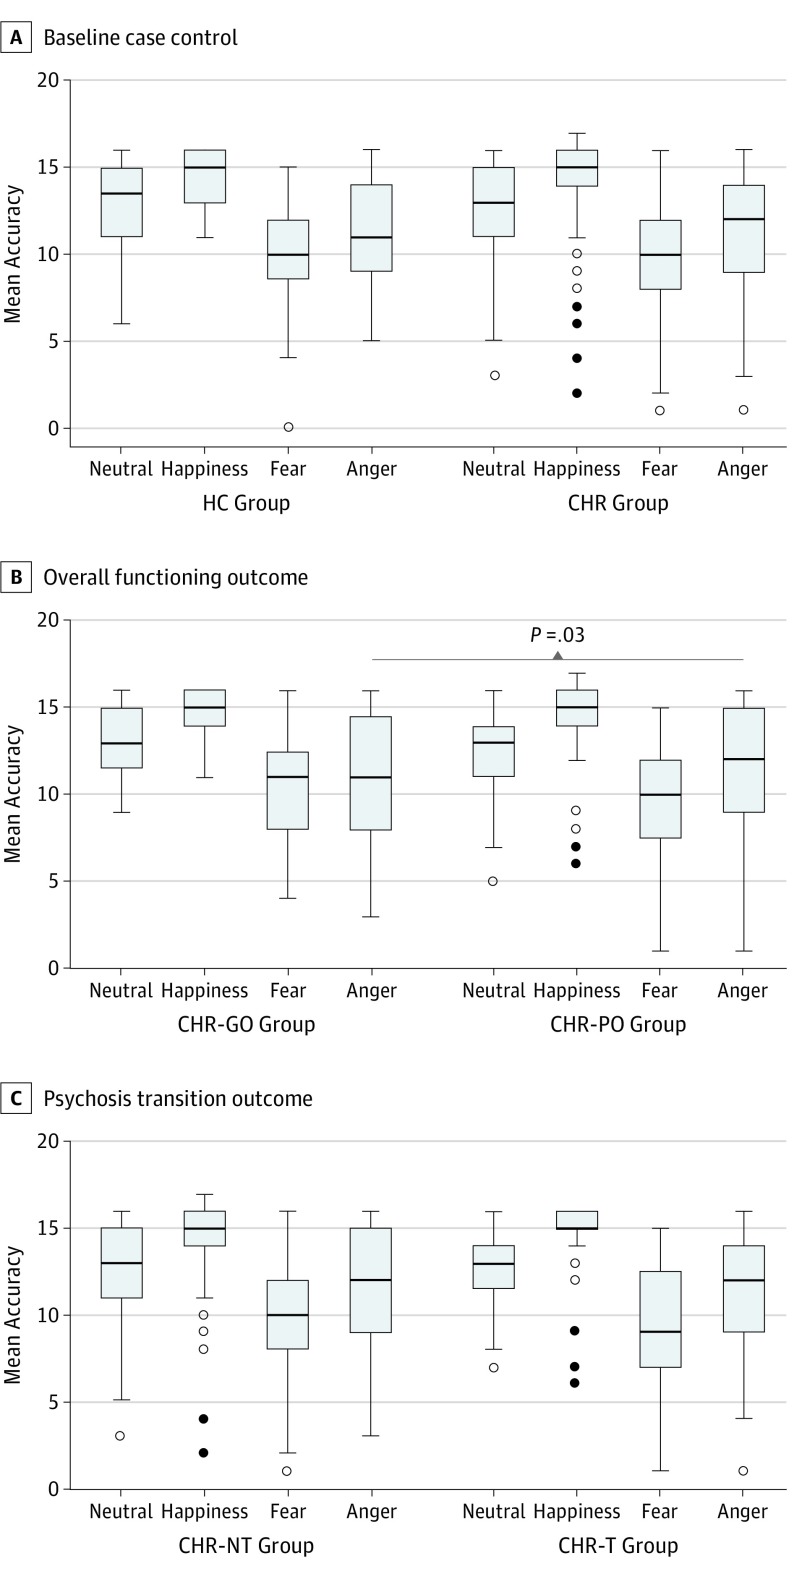
Figure 1. Group Differences in Emotion Recognition .
A, The healthy control (HC) group comprised 52 participants, and the clinical high risk (CHR) group comprised 213 participants. B, The CHR with good overall functioning (CHR-GO) group comprised 39 participants, and the CHR with poor overall functioning (CHR-PO) group comprised 91 participants. C, The CHR–nontransitioned (CHR-NT) group comprised 169 outcomes, and the CHR–transitioned (CHR-T) group comprised 44 outcomes. The group differences were adjusted for age, sex, IQ, site, and general facial recognition. The horizontal line in each box represents the median; top and bottom box borders, 75th and 25th percentiles, respectively; whiskers, 90th and 10th percentiles; white circles, out values; and black circles, far out values.

