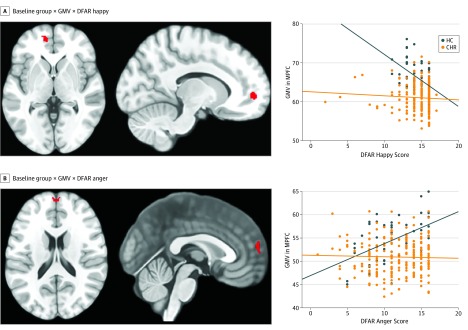
Figure 2. Baseline Associations Between Emotion Recognition (DFAR), Gray Matter Volume (GMV), and Group Status .
The healthy control (HC; blue) group comprised 52 participants, and the clinical high risk (CHR; orange) group comprised 213 participants. Baseline associations were adjusted for age, sex, IQ, scanner, and general facial recognition (familywise error P < .05). MPFC indicates medial prefrontal cortex; DFAR, degraded facial affect recognition. Orange marks are the statistical parametric maps of the interactions between GMV, DFAR performance, and group overlaid on a standard T1 template in MRICron software (NITRC).

