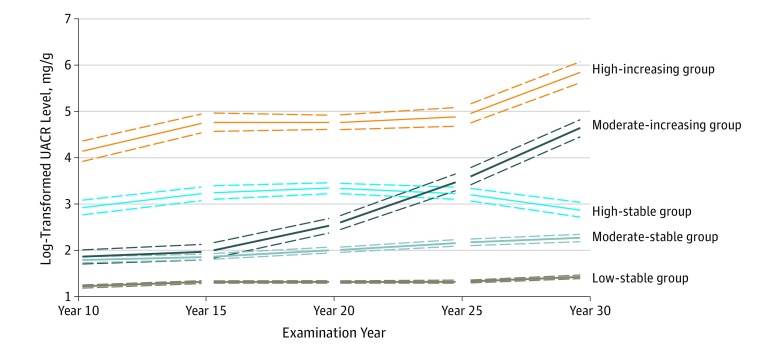
Figure 1. Trajectories of Albuminuria.
Of the 2990 participants included for trajectory group modeling, there were 1923 in the low-stable group, 785 in the moderate-stable group, 136 in the high-stable group, 99 in the moderate-increasing group, and 47 in the high-increasing group. Dotted lines indicate 95% CIs. UACR indicates urine albumin-to-creatinine ratio.

