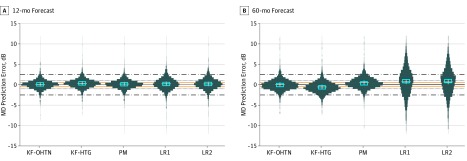
Figure 2. The Proportion of Mean Deviation (MD) Forecasting Errors Between 0.5, 1.0, and 2.5 dB of the Actual Value for Patients With Ocular Hypertension.
Shorter, fatter violin plots indicate greater concentration and less variation in prediction error compared with longer, thinner plots. The horizontal lines capture values within 0.5 dB (orange solid lines), 1.0 dB (black dotted lines), and 2.5 dB (black dashed and dotted lines) of the actual values. The white plus sign in the middle of each plot represents the mean, and the cyan rectangle indicates the median. KF-HTG indicates Kalman filter parameterized using patients with high-tension glaucoma; KF-OHTN, KF parameterized using patients from the Ocular Hypertension Treatment Study with ocular hypertension; LR1 and LR2, linear regression 1 and 2 models; and PM, personalized mean.

