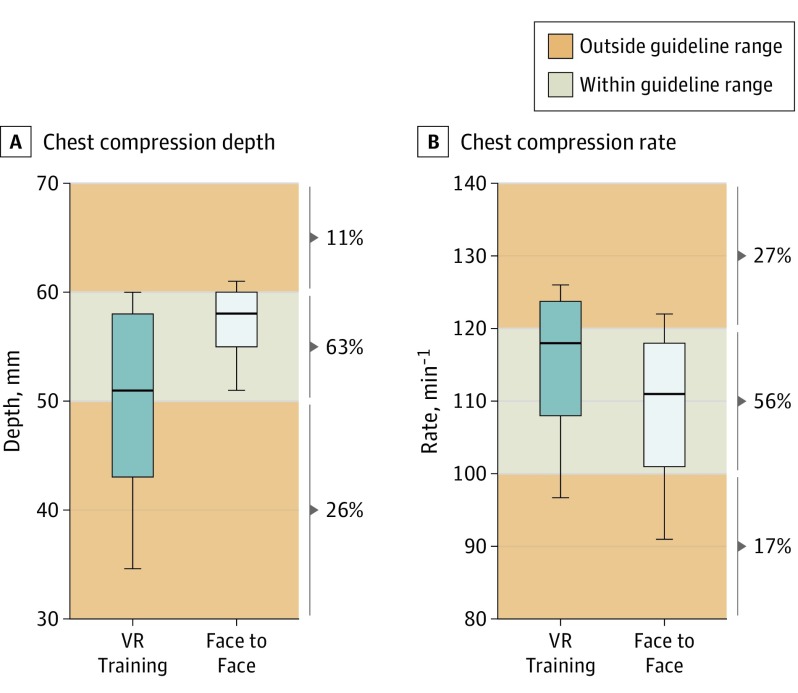
Figure 3. Boxplots of Chest Compression Depth and Rate in Relation to Guideline Recommendations.
Boxplots of chest compression rate and depth. Whiskers are 10th and 90th percentiles. Percentages at the side of each graph indicate the proportion of participants with compression depth or rate that is below, within, or above guideline-endorsed ranges respectively. VR indicates virtual reality.

