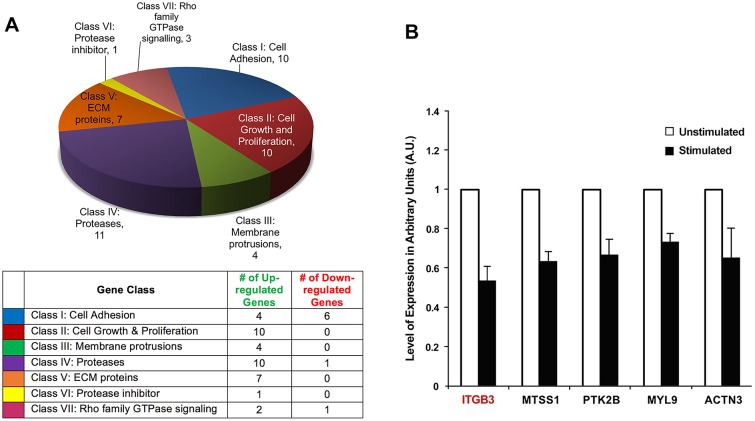
Fig. 2.
Differentially expressed genes resulting from mechanical stimulation. (A) qPCR array analysis of genes found to have a ±1.35-fold differential expression upon mechanical stimulation. The genes were classified into seven groups. The pie chart illustrates the number of differentially expressed genes within each class and the table contains the number of up- and down-regulated genes within each class. (B) qPCR confirmation of select genes with downregulated expression upon stimulation. These differentially expressed genes were selected for further confirmation by qPCR. Three biological replicates were used for qPCR of ITGB3, MTSS1, MYL9 and ACTN3; four biological replicates were used for qPCR of PTK2B. For every biological replicate, two technical replicates were performed; values represent mean±s.e.m. All results were P<0.05 (two-tailed t-test).

