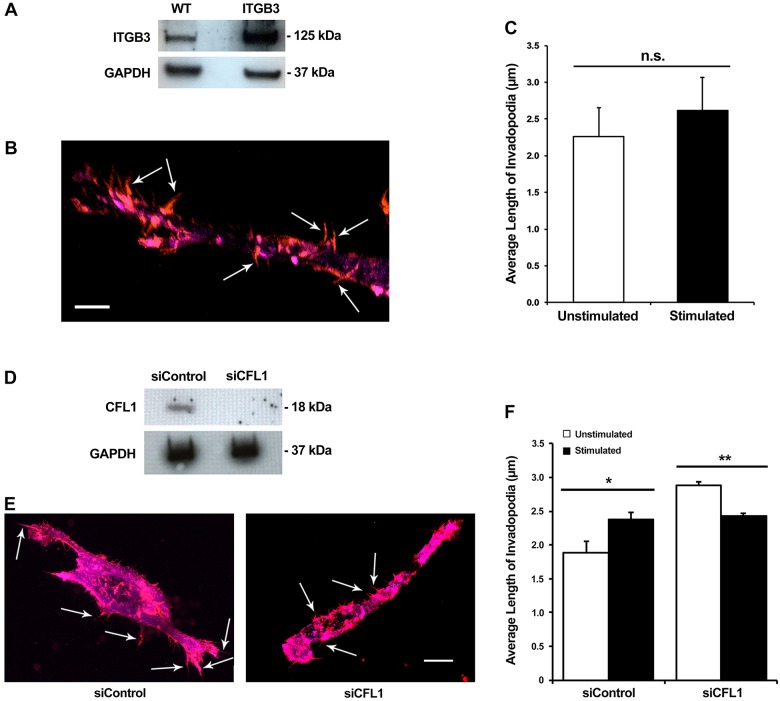
Fig. 6.
Overexpression of integrin β3 and downregulation of cofilin expression both negatively affect the lengthening of invadopodia upon stimulation. (A) Western blot confirming overexpression of integrin β3 in protein lysates from control vector (WT) and integrin β3 (ITGB3)-overexpressing cells after 48 h. (B) A representative confocal fluorescent image of a fixed cell with integrin β3 overexpression residing within the collagen–fibronectin matrix. Red indicates actin and magenta indicates cortactin. Invadopodia are indicated by the arrows. Scale bar: 5 µm. (C) Measurement of invadopodia length with and without stimulation in cells that overexpress integrin β3. Results are mean±s.e.m. from four biological replicates. n.s., not significant (two-tailed t-test). (D) Western blot of cofilin knockdown by cofilin-specific siRNA (siCFL1). siControl, control siRNA. (E) Representative confocal fluorescent images of control siRNA and siCFL1 nucleofected cells chemically fixed within the matrix. Red indicates actin and magenta indicates cortactin. Arrows indicate individual invadopodia. Scale bar: 10 µm. (F) Invadopodia length with and without stimulation in cells nucleofected with control siRNA and siCFL1. Results are mean±s.e.m. from four biological replicates. *P<0.05, **P<0.01 (two-tailed t-test).

