Figure 1.

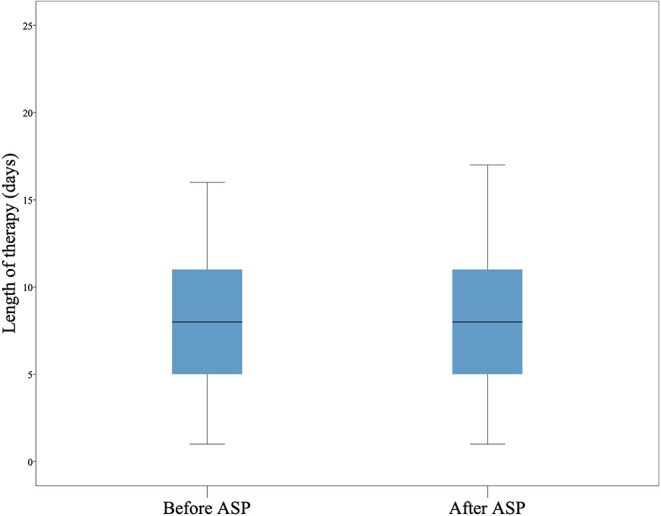
Length of therapy. The length of therapy (LOT) in days is shown as boxplot. The LOT did not differ before and after the intervention.

Length of therapy. The length of therapy (LOT) in days is shown as boxplot. The LOT did not differ before and after the intervention.