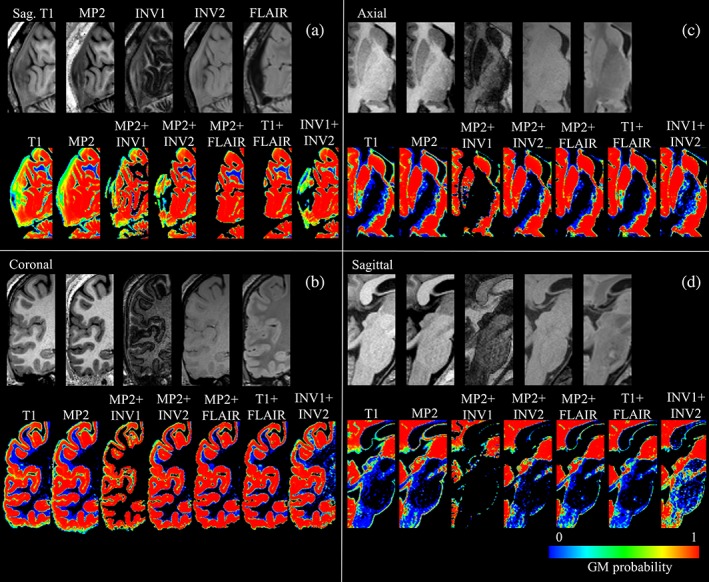
Figure 3.

Segmentation results in the individual native space, with up‐sample from 1 to 0.5 mm3 for appreciating segmentation differences across all combinations. (a) Shows native T1, MP2, INV1, INV2, and FLAIR images in sagittal view, with GM segmentation probabilities (0–1) for all combinations, that is, T1, MP2, MP2 + INV1, MP2 + INV2, MP2 + FLAIR, T1 + FLAIR, and INV1 + INV2 for visual review of dura and vessels. (b) Shows the native images and segmentation results for the visual analysis of cortical segmentation, in the coronal plane. (c) Shows subcortical segmentation of thalamus and putamen (mainly posterior putamen) for all segmentation combinations in the axial view and (d) shows the segmentation of brain stem [Color figure can be viewed at http://wileyonlinelibrary.com]
