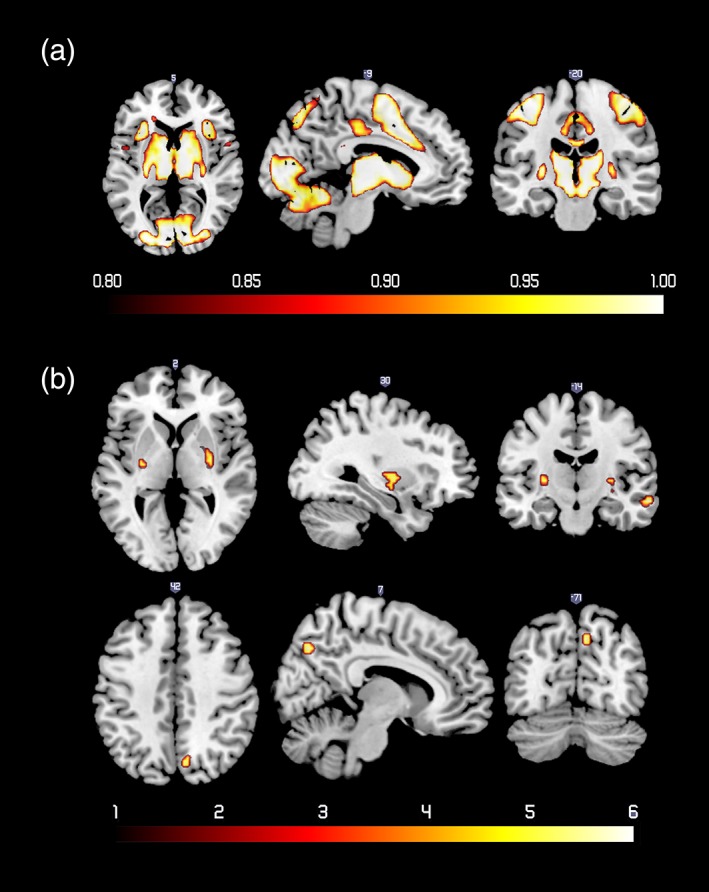
Figure 2.

(a) Probabilistic map of positive activation during reward anticipation. The color bar denotes the probability of activation. (b) Regions that showed more activity for male compared with female adolescents during reward anticipation. The color bar denotes t values [Color figure can be viewed at http://wileyonlinelibrary.com]
