Figure 4.

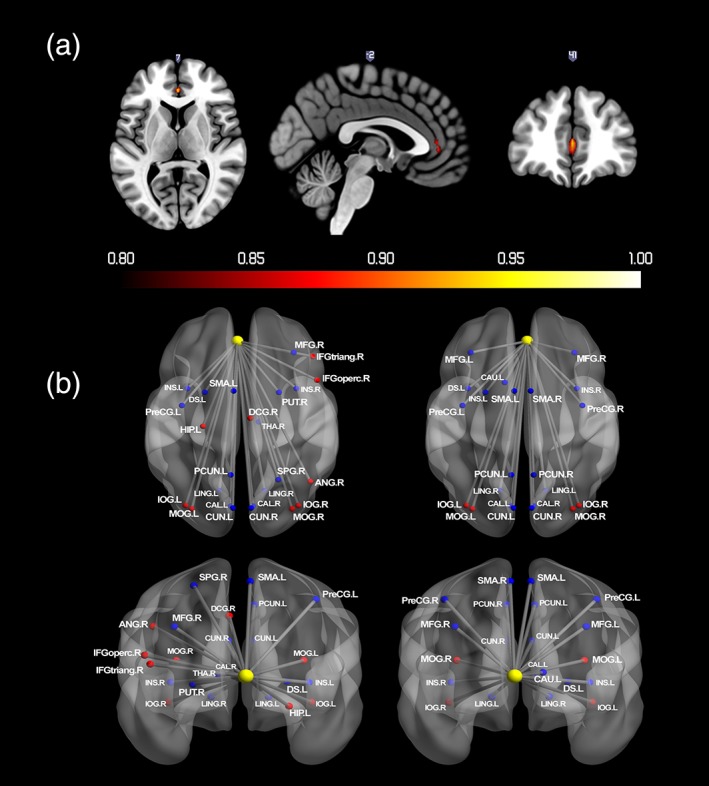
(a) Probabilistic map for positive activation during reward receipt. The color bar denotes the probability of activation. (b) Regions that showed significant changes in functional connectivity with vmPFC during reward receipt. Nodes drawn in red indicate regions showed positive connectivity with the seed region. Blue indicates negative connectivity. Unified MNI coordinates are used for the display purpose. The MNI coordinates used for plots are shown in the Supporting Information Materials. ACG, anterior cingulate gyri; CAL, calcarine; CAU, caudate; CUN, cuneus; DS, dorsal striatum; HIP, hippocampus; IFGoperc, inferior frontal gyrus; opercular part; IFGtriang, inferior frontal gyrus; triangular part; IOG, inferior occipital gyrus; INS, insula; LING, lingual gyrus; DCG, median cingulate gyri; MFG, middle frontal gyrus; MOG, middle occipital gyrus; PreCG, precentral gyrus; PCUN, Precuneus; PUT, putamen; SMA, supplementary motor area; THA, thalamus; L, left; R, right [Color figure can be viewed at http://wileyonlinelibrary.com]
