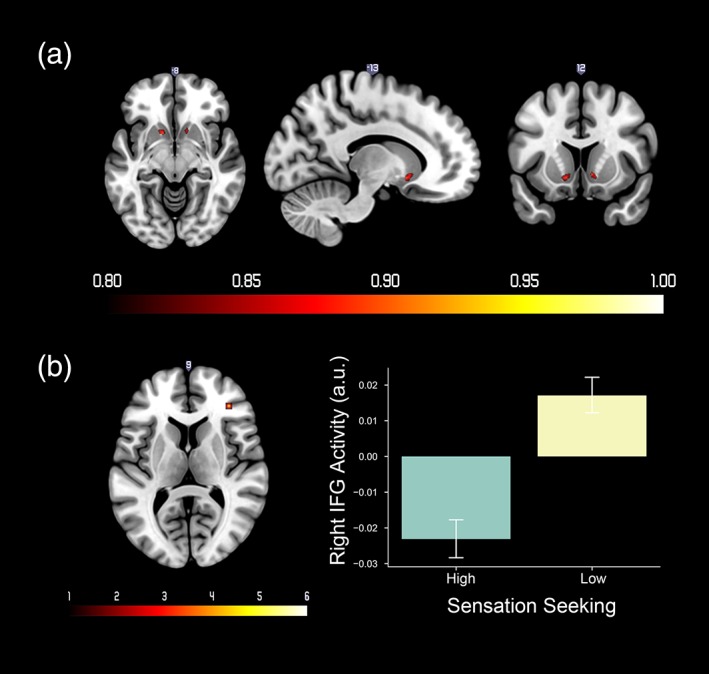
Figure 7.

(a) Probabilistic map of positive activation in response to reward prediction error (PE). The color bar denotes the probability of activation. (b) Left: Regions that showed different activity associated with reward PE between low sensation seeking group versus high sensation seeking group. The color bar denotes t values. Right: Mean and standard error of right IFG activity for high and low sensation seeking groups. Right IFG activity from the contrast image was extracted from a 3‐mm spherical ROI at MNI coordinates: 36, 38, 10 [Color figure can be viewed at http://wileyonlinelibrary.com]
