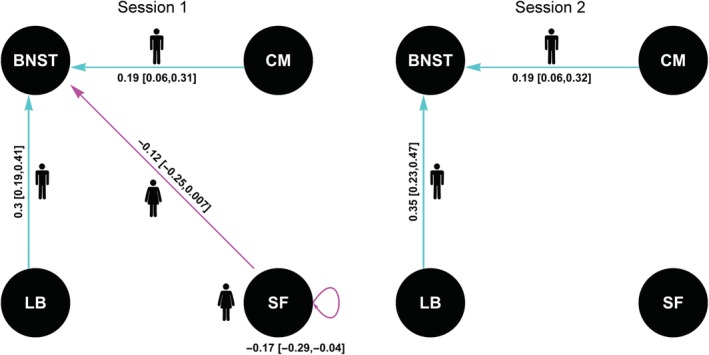
Figure 3.

Effects of sex on effective connectivity (EC) parameters. The values show the estimate and its 95% credible interval in brackets. Larger EC in males is represented by a male symbol and shown in cyan. Larger EC in females is represented by a female symbol and shown in magenta [Color figure can be viewed at http://wileyonlinelibrary.com]
