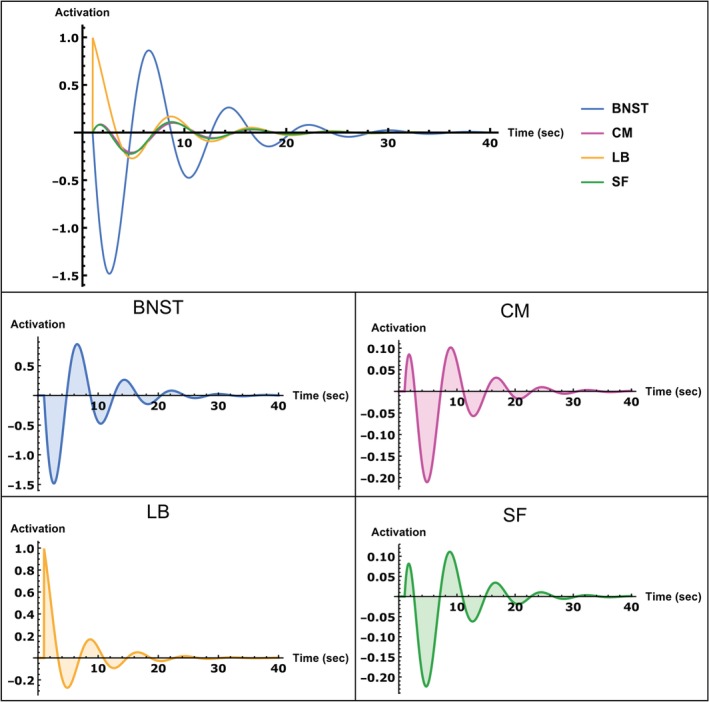
Figure 4.

Impulse response of the group‐level dynamic causal model (DCM) equations to an impulse input into the laterobasal nucleus (LB) shown over a period of 40 s. Top row: Impulse responses of all regions in one plot for an easier comparison of the magnitude of activations of each region of interest (ROI). Middle/bottom row: Impulse response of each ROI separately. Activity scale is arbitrary, but positive values indicate upregulation, whereas negative values indicate downregulation; time units are in seconds [Color figure can be viewed at http://wileyonlinelibrary.com]
