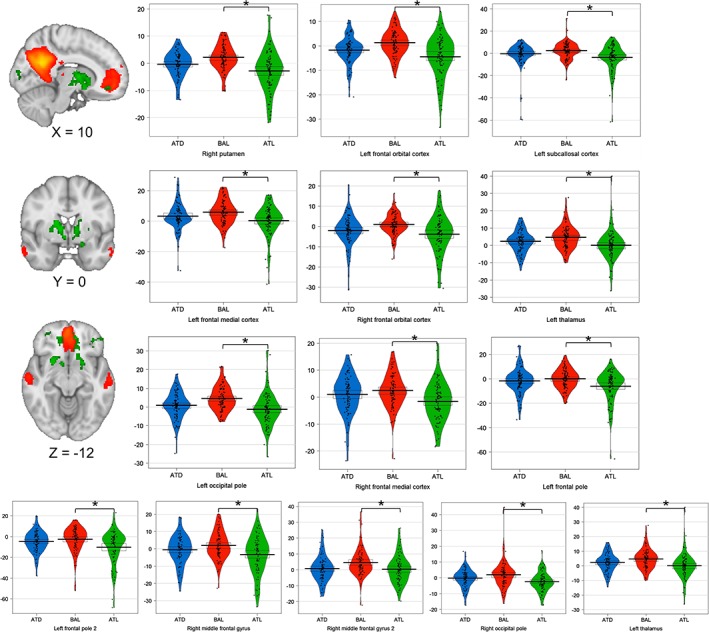
Figure 3.

Changes in DMN functional connectivity following tryptophan manipulations. The image slices on the left side show the spatial map of the DMN (precuneus, PCC, mPFC, retrosplenial cortex, and hippocampus) as identified by Smith et al. (2009) displayed in red‐orange. The clusters with decreased functional connectivity to the DMN after acute tryptophan loading (ATL) are displayed in green colors. MNI coordinates are presented below each image. Images are displayed in radiological orientation (left = right). The plots represent the distribution of the parameter estimates (in arbitrary units) of the brain regions that were affected by the tryptophan manipulations (as shown in Table 2). Horizontal lines on the plots represent means and 95% confidence intervals. *p < 0.05, FWE corrected and adjusted for six comparisons performed [Color figure can be viewed at http://wileyonlinelibrary.com]
