
Figure 8.
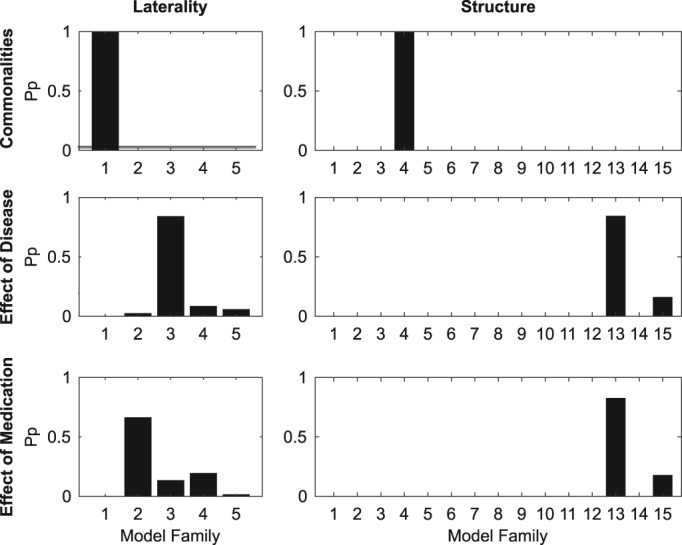
Results of Bayesian model family comparison for between‐group commonalities and differences. Left column of bar graphs: laterality model family, right column: structure model family. The y‐axis corresponds to the posterior probability, whereas the x‐axis corresponds to the model families within the given type of model family. Five laterality model families (1 — symmetrical, 2 — contralaterally‐lateralized, 3 — ipsilaterally‐lateralized, 4 — left‐lateralized, 5 — right‐lateralized) and 15 structure model families (see Figure 4) were compared